
EVN User Experiment Pipeline Feedback
Last updated: Thu Jul 15 13:43:15 CEST 2004
campbell@jive.nl
General Comments.
(
Brief data summary
and
scan listing
)
This experiment comprised 8 stations with 1 8MHz IFs at L-band, with 2 polarizations. There were 1024 frequency points per IF/pol, and integration times were 2s. Considerably more information is included in the experiment's cover letter on the standard-plots portion of the archive. In the pipeline, only J0958, DA193, 2007, and 4C39.25 were fringed. Data were UVAVG'd to 4s (from 0.5s), and a SOLINT of 2.5min was used (2 ~equal segments per J0958 scan).
The EVN reliability indicator was ERI=0.98. ERI estimates the ratio of good -to- expected visibilities. This was considering periods of excessing slew, diagonal weights, and other issues discussed in the cover letter as being unexpected loss. Wb's being out of HA limits at the beginning and end wasn't considered as loss, but did affect the number of telescopes in the array at a given time. The dead track on Cm RCP for head-group A didn't subtract from the ERI, because the baselines seem okay (i.e., didn't reduce ERI because of the affect on autocorrelations).
Plots of the autocorrelations
.
Comments.
84p of plots, J0958 in ~22min chunks. RFI and/or internal birdies in several stations' IF/pols. See cover letter for more details. (plots start with p43 for some reason in my 'gv'). Cm's bad track on head-group A can be seen in the RCP plots in alternating periods (of 2 tape passes).
Plots of the uncalibrated amplitude and phase against time
.
Comments.
full-experiment Ef-* baselines, no calibration applied.
Plots of the uncalibrated amplitude and phase against frequency
channel
.
Comments.
84p of plots, each scan of J0958, DA193, 2007, and 4C39.25 for Ef-* baselines, both parallel-hand polarizations (subsequent plots are limited to these sources).
The uncalibrated amplitude and phase of the crosshand
correlations against frequency channel
(not available)
.
Comments.
TSYS against time
.
Comments.
TY1 table. There was no Cm Tsys info -- set to 1.
Telescope sensitivities
from the a priori TSYS and Gain curves (the square of this
number gives the antenna noise (SEFD) in Jy - the smaller the better).
Comments.
gain from CL2 table. The Tr gain curve as supplied by the station was clearly wrong (went negative above El~40deg). Replaced with a flat curve. The curve for Nt looks suspicious, but I used it as is anyway.
Fringe-fit phase solutions
(including Parallactic Angle correction).
Comments.
CL3 station phase solutions. some phase-connections are clearly affected by RATE outliers.
Fringe-fit delay solutions
.
Comments.
SN2 station delay solutions. some obvious outliers (1 in Wb R&L)
Fringe-fit rate solutions
.
Comments.
SN2 station rate solutions (1-2 obvious outliers in each station that affect automatic AIPS-determined phase-connection decisions).
Telescope bandpasses
.
Comments.
bandpass table 1. A source that happened to have observations only in head-group B passes was used (DA193) to avoid problems with the Cm autocorrelations from head-group A.
Calibrated amplitude and phase against time
(a priori amplitude calibration and fringe-fit solutions applied).
Comments.
Ef-* baselines calibrated with table CL3. There are a couple of obviously high amplitude outliers (e.g., Ef-Tr LL)
Calibrated amplitude and phase against frequency channel
.
Comments.
84p of plots, showing Ef-* baselines calibrated with CL3 and BP1. The high-frequency side of the band has been apparently overcompensated in the bandpass correction process.
Naturally weighted dirty map produced before self-cal of:
J0958+6533:
postscript
, or
FITS
.
DA193:
postscript
, or
FITS
.
4C39.25:
postscript
, or
FITS
.
2007+777:
postscript
, or
FITS
.
Comments.
Natural-weighted (dirty) maps for the calibrators J0958, DA193, 2007, and 4C39.25.
Uniformly weighted dirty map produced before self-cal of:
J0958+6533:
postscript
, or
FITS
.
DA193:
postscript
, or
FITS
.
4C39.25:
postscript
, or
FITS
.
2007+777:
postscript
, or
FITS
.
Comments.
Uniform-weighted (dirty) maps of the above calibrators.
Phase corrections applied to a priori calibrated and fringe-fitted data by self-calibration.
J0958+6533.
DA193.
4C39.25.
2007+777.
Comments.
For each of the calibrators (J0958, DA913, 2007, 4C39.25), plots post-SPLIT table SN1. The latter 3 had only 1 or 2 pairs of scans.
Amplitude corrections applied to a priori calibrated and fringe-fitted data by self-calibration.
J0958+6533:
postscript
, or
text file
.
DA193:
postscript
, or
text file
.
4C39.25:
postscript
, or
text file
.
2007+777:
postscript
, or
text file
.
Comments.
As above, but for the post-SPLIT table SN2
Telescope sensitivities
(the total AMP gain applied during
both a priori and self calibration; the square of this number gives the antenna
noise (SEFD) in Jy).
Comments.
CL4 gain-amp.
Residual closure phase (visibility closure phase with model closure phase subtracted) for:
J0958+6533
.
DA193
.
4C39.25
.
2007+777
.
Comments.
Prior to the stage of making this and the next 4 kinds of plots, I added a step for automatic flagging in VPLOT. Without this step, some of the high points mentioned in the cover letter (& visible in the 'standard' plots) apparently were affecting the automatic self-cal solutions (especially for J0958).
For each of the calibrators (J0958, DA193, 2007, 4C39.25), 24p of plots showing closure phase for the triangles (not just Ef-*-*).
Calibrated visibilities and the source model of:
J0958+6533
.
DA193
.
4C39.25
.
2007+777
.
Comments.
For each of the calibrators, plots of amp/phase on Ef-* baselines calibrated with (post-SPLIT) table CL3, with a model-line overplotted.
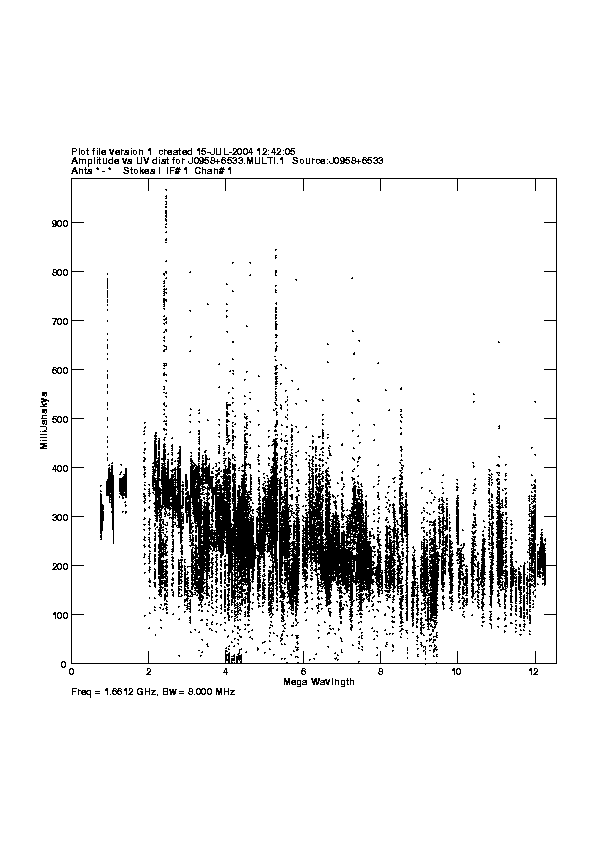
Calibrated visibilities against u,v distance for:
J0958+6533.
postscript
, or
png (smaller)
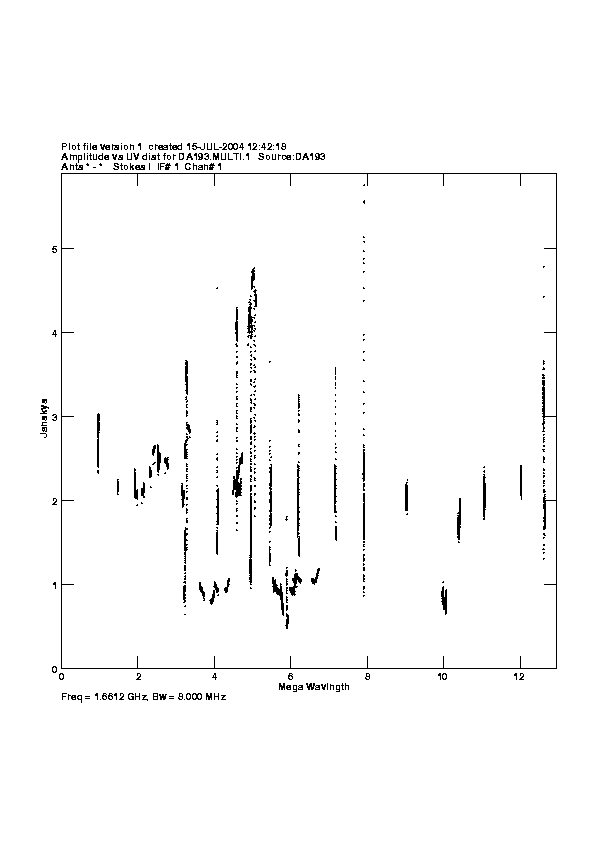
DA193.
postscript
, or
png (smaller)
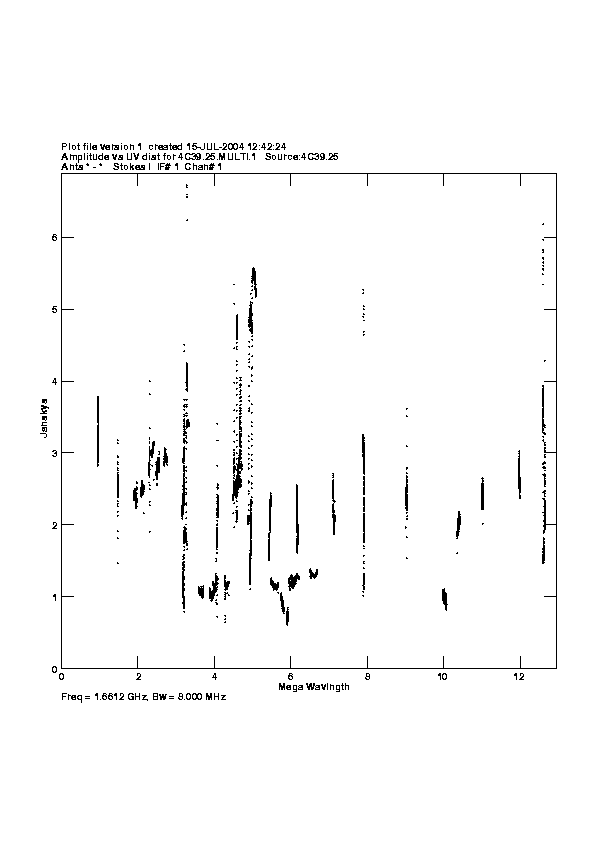
4C39.25.
postscript
, or
png (smaller)
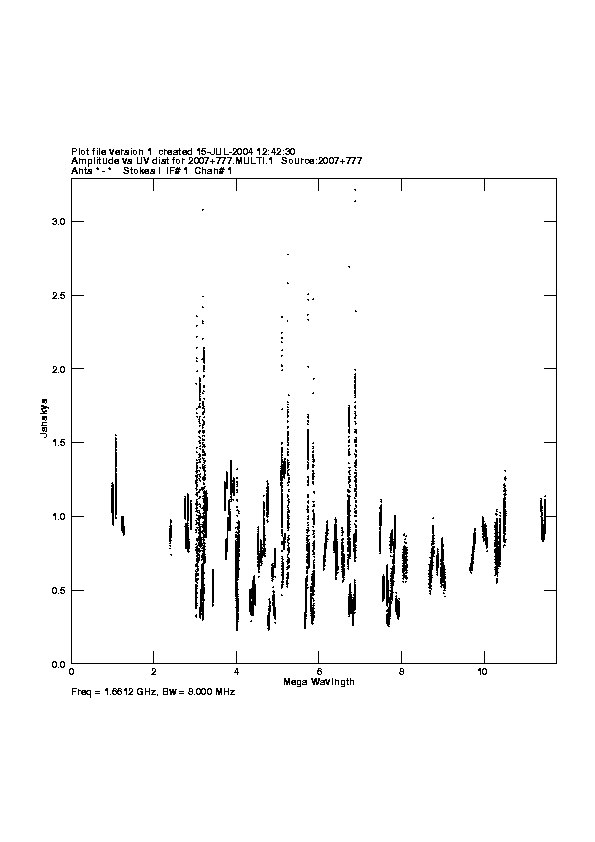
2007+777.
postscript
, or
png (smaller)
Comments.
For each of the calibrators, a plot of amp vs. |uv| distance.
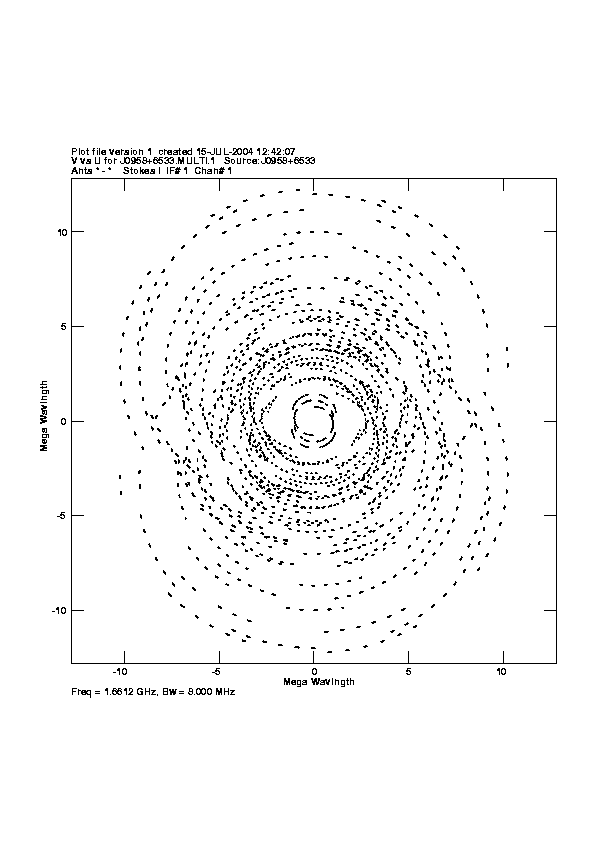
u,v coverage for:
J0958+6533.
postscript
, or
png (smaller)
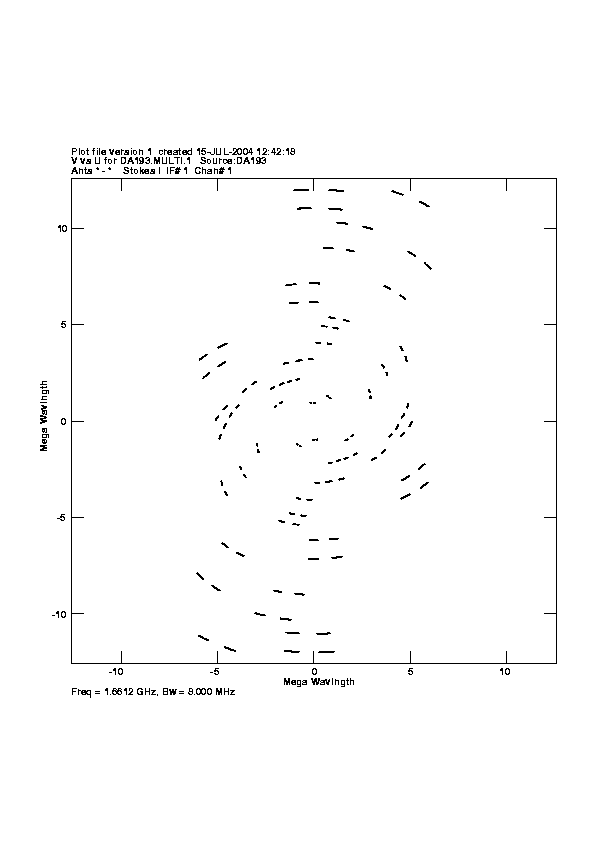
DA193.
postscript
, or
png (smaller)
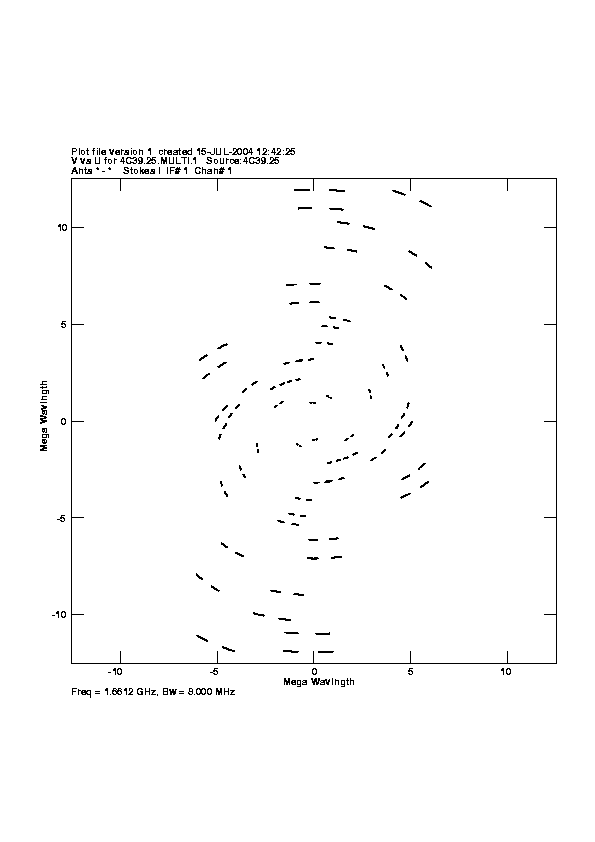
4C39.25.
postscript
, or
png (smaller)
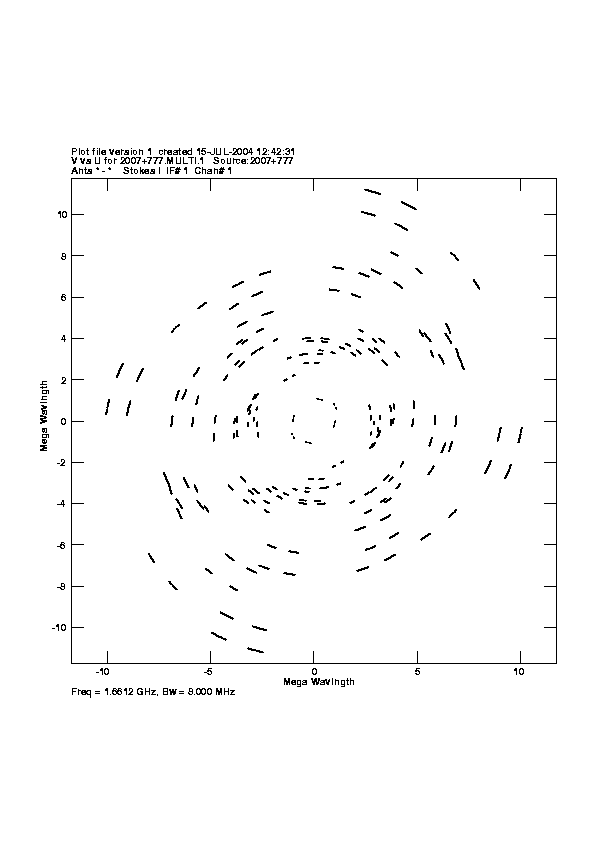
2007+777.
postscript
, or
png (smaller)
Comments.
For each of the calibrators, a plot of the u-v coverage.
J0958+6533:
postscript
, or
FITS
.
DA193:
postscript
, or
FITS
.
4C39.25:
postscript
, or
FITS
.
2007+777:
postscript
, or
FITS
.
Comments.
For each of the calibrators, a CLEAN map resulting from the automated fringing/self-cal pipeline script.