
EVN User Experiment Pipeline Feedback
Last updated: Wed Aug 22 09:56:00 CEST 2012
campbell@jive.nl
General Comments.
(
Brief data summary
and
scan listing
)
EG063A had 11 stations, 8 16MHz IFs, two polarizations 32 frequency points per IF/pol, and 2s integrations. Considerably more information is included in the experiment's cover letter on the standard-plots portion of the EVN Archive. The SOLINT was set to 120s. Ef, and then Mc were used as the reference stations.
The EVN reliability indicator (ERI) for this experiment was
ERI = 0.707 . ERI* = 0.707 .
The losses include Ys having fringes very far below the expected strength, and Hh,Sh,Ar missing IF2/RCP (which counted more against Sh & Ar since that corresponded to 1/4 of the data which they could transfer via the e-VLBI).
Plots of the autocorrelations
Comments.
Each scan plotted separately, all stations.
plots of the uncalibrated amplitude and phase
against time
Comments.
Full-experiment for Ef-* baselines, no calibration applied. A 1 minute plot-averaging was used.
Plots of the uncalibrated amplitude and phase
against frequency channel
Comments.
Scalar averaged Ef-* baselines, each scan plotted separately. No calibration applied yet.
The uncalibrated amplitude and phase of the crosshand
correlations against frequency channel
(not available)
Comments.
TSYS against time
Comments.
TY1 table, each IF/pol on a separate plot. As of 23 aug 2012, the original pipelinig using only the nominal SEFD for Ef has been re-done using actual Tsys values from the station.
Telescope sensitivities
from the a priori TSYS and Gain
curves (the square of this number gives the antenna noise (SEFD) in Jy - the
smaller the better).
Comments.
Gain amplitude from CL2 table.
Fringe-fit phase solutions
(including Parallactic
Angle correction).
Comments.
CL3 station phase solutions -- CL3 = CL2+SN2, thus also includes the initial amplitude/parallactic angle calibration from CL2 and the fringe solutions from SN2. Traces for both the target and phase-ref source can be seen.
Fringe-fit delay solutions
Comments.
SN2 station delay solutions for the fringed sources, each IF/pol on a separate plot. Ys has many discrepant solutions, but not flagged here. For this experiment, one lag corresponds to 1/32 microsecond of delay.
Fringe-fit rate solutions
Comments.
SN2 station rate solutions. Tr's high residual rate can be seen here (and in the FRING_PHAS plot).
Telescope bandpasses
Comments.
Bandpass table 1. M87 itself was used for bandpass calibration.
Calibrated amplitude and phase against time
(a
priori amplitude calibration and fringe-fit solutions applied).
Comments.
Full-experiment for Ef-* baselines, calibrated with CL3. The 1-min plot-averaging still applied.
Calibrated amplitude and phase against frequency
channel
Comments.
Ef-* baselines calibrated with CL3 and BP1. The amp and phase plots self-scale, not necessarily going down to 0 in the case of the amps.
Naturally weighted dirty map (not useful for bright sources)
produced before self-cal of:
M87: pdf (not available)
, or
FITS (not available)
.
Comments.
Uniformly weighted dirty map (not useful for bright sources)
produced before self-cal of:
M87: pdf (not available)
, or
FITS (not available)
.
Comments.
Phase corrections applied to a priori calibrated and
fringe-fitted data by self-calibration.
M87
.
Comments.
Plots of post-SPLIT tables SN1 for the sources that have been individually fringed.
Amplitude corrections applied to a priori calibrated and
fringe-fitted data by self-calibration.
M87:
pdf
, or
text file
, or
statistical summary
.
Comments.
As above, but for the post-SPLIT table SN2.
Telescope sensitivities
(the total AMP gain applied
during both a priori and self calibration; the square of this number gives the
antenna noise (SEFD) in Jy).
Comments.
CL4 gain-amp. Jb & On have individual spikes that throw off the y-axis scale somewhat.
Residual closure phase (visibility closure phase with model closure phase subtracted) for:
M87
.
Comments.
Separate files per (fringed) source, showing closure phase plots for all the triangles. Only stokes=I shown.
Calibrated visibilities and the source model of:
M87
.
Comments.
For each (fringed) source, plots of amp/phase on Ef-* baselines, calibrated with (post-SPLIT) table CL3, with a model-line overplotted.
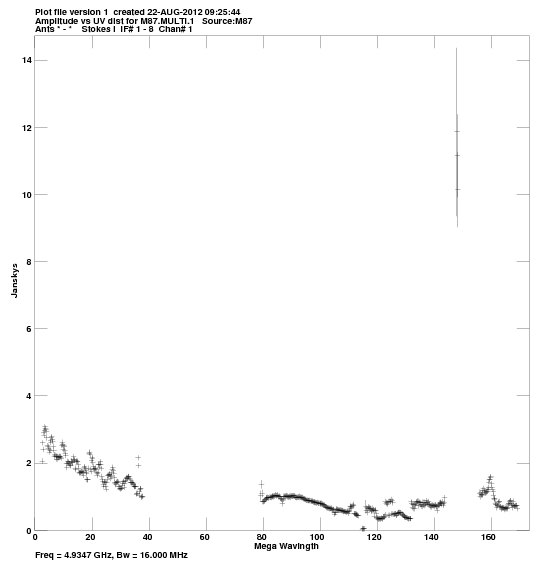
Calibrated visibilities against u,v distance for:
M87:
pdf
, or
png
.
Comments.
For each source, a plot of amp vs. |uv| distance. One clear high-amp outlier at about 148 Mlambda.
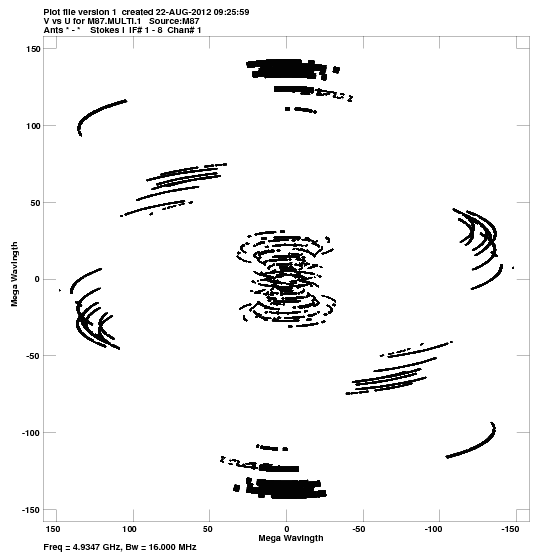
u,v coverage for:
M87:
pdf
, or
png
.
Comments.
For each source, a plot of the u-v coverage.
Crude maps of sources:
M87:
pdf
, or
FITS
.
Comments.
For each source, a CLEAN map resulting from the automated fringing and self-cal iterations in the pipeline script.