
EVN User Experiment Pipeline Feedback
Last updated: Tue Oct 8 18:32:10 CEST 2013
campbell@jive.nl
General Comments.
(
Brief data summary
and
scan listing
)
EG072A had 15 stations, 8 16MHz IFs, 2 polarizations, 64 frequency points per IF/pol, and 0.5s integrations. Considerably more information is included in the experiment's cover letter on the standard-plots portion of the EVN Archive. This pipelining corresponds to the multiple phase-center output target HERCULESA. In the pipelining, the target sources were treated as phase-reference targets and were not separately fringe-fit. The SOLINT was set automatically to a value commensurate with a typical reference-source scan (~90s) Ef, Tr, and then Ys were used as the reference stations.
The EVN reliability indicator (ERI) for this experiment was
ERI = 0.921 . ERI* = 0.921 .
The losses include Sv RR for the whole experiment, and Wb missing the first hour.
Plots of the autocorrelations
Comments.
Each scan plotted separately, all stations.
plots of the uncalibrated amplitude and phase
against time
Comments.
Full-experiment for Ef-* baselines, no calibration applied. A 1.75 minute plot-averaging was used.
Plots of the uncalibrated amplitude and phase
against frequency channel
Comments.
Scalar averaged Ef-* baselines, each scan plotted separately. No calibration applied yet.
The uncalibrated amplitude and phase of the crosshand
correlations against frequency channel
(not available)
Comments.
TSYS against time
Comments.
TY1 table, each IF/pol on a separate plot.
Telescope sensitivities
from the a priori TSYS and Gain
curves (the square of this number gives the antenna noise (SEFD) in Jy - the
smaller the better).
Comments.
Gain amplitude from CL2 table.
Fringe-fit phase solutions
(including Parallactic
Angle correction).
Comments.
CL3 station phase solutions -- CL3 = CL2+SN2, thus also includes the initial amplitude/parallactic angle calibration from CL2 and the fringe solutions from SN2. Each station seem to have instances of questionable phase-connection "decisions", usually at the times of lower elevation.
Fringe-fit delay solutions
Comments.
SN2 station delay solutions for the fringed sources, each IF/pol on a separate plot. Sv RCP channels weren't explicitly flagged; only a few fringe solutions in these.
Fringe-fit rate solutions
Comments.
SN2 station rate solutions. Sv residual rate about 2mHz.
Telescope bandpasses
Comments.
Bandpass table 1. J1651+0129, J1640+1220, and J1649+0626 were used for bandpass calibration (Zc & Bd had no scans on the two principal fringe-finders, so using the main phase-reference source was also required).
Calibrated amplitude and phase against time
(a
priori amplitude calibration and fringe-fit solutions applied).
Comments.
Full-experiment for Ef-* baselines, calibrated with CL3. The 1.75-min plot-averaging still applied.
Calibrated amplitude and phase against frequency
channel
Comments.
Ef-* baselines calibrated with CL3 and BP1. The amp and phase plots self-scale, not necessarily going down to 0 in the case of the amps.
Naturally weighted dirty map (not useful for bright sources)
produced before self-cal of:
J1649+0626: pdf (not available)
, or
FITS (not available)
.
J1640+1220: pdf (not available)
, or
FITS (not available)
.
HERCULESA:
pdf
, or
FITS
.
J1651+0129: pdf (not available)
, or
FITS (not available)
.
Comments.
Naturally-weighted dirty maps of the phase-referenced-to sources.
Uniformly weighted dirty map (not useful for bright sources)
produced before self-cal of:
J1649+0626: pdf (not available)
, or
FITS (not available)
.
J1640+1220: pdf (not available)
, or
FITS (not available)
.
HERCULESA:
pdf
, or
FITS
.
J1651+0129: pdf (not available)
, or
FITS (not available)
.
Comments.
Uniformly-weighted dirty maps of the phase-referenced-to sources.
Phase corrections applied to a priori calibrated and
fringe-fitted data by self-calibration.
J1649+0626
.
J1640+1220
.
HERCULESA (not available)
.
J1651+0129
.
Comments.
Plots of post-SPLIT tables SN1 for the sources that have been individually fringed.
Amplitude corrections applied to a priori calibrated and
fringe-fitted data by self-calibration.
J1649+0626:
pdf
, or
text file
, or
statistical summary
.
J1640+1220:
pdf
, or
text file
, or
statistical summary
.
HERCULESA: pdf (not available)
, or
text file (not available)
, or
statistical summary (not available)
.
J1651+0129:
pdf
, or
text file
, or
statistical summary
.
Comments.
As above, but for the post-SPLIT table SN2.
Telescope sensitivities
(the total AMP gain applied
during both a priori and self calibration; the square of this number gives the
antenna noise (SEFD) in Jy).
Comments.
CL4 gain-amp. The square of these values is a sort of achieved SEFD after self-cal'ing. The remaining Sv/RR channels correspond to around 22000 Jy.
Residual closure phase (visibility closure phase with model closure phase subtracted) for:
J1649+0626
.
J1640+1220
.
HERCULESA (not available)
.
J1651+0129
.
Comments.
Separate files per (fringed) source, showing closure phase plots for all the triangles. Only stokes=I shown.
Calibrated visibilities and the source model of:
J1649+0626
.
J1640+1220
.
HERCULESA (not available)
.
J1651+0129
.
Comments.
For each (fringed) source, plots of amp/phase on Ef-* baselines, calibrated with (post-SPLIT) table CL3, with a model-line overplotted.
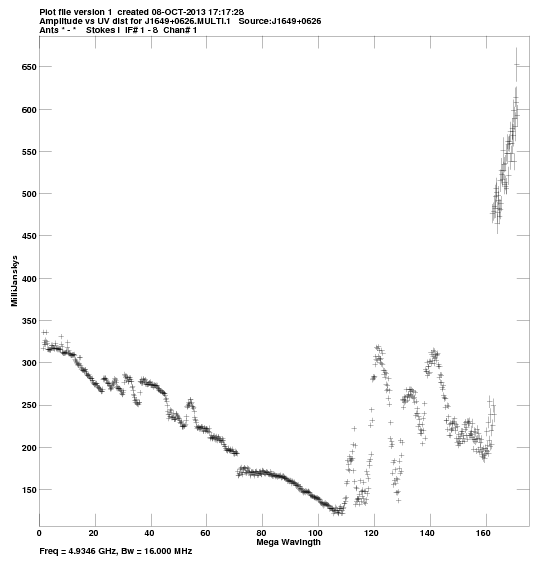
Calibrated visibilities against u,v distance for:
J1649+0626:
pdf
, or
png
.
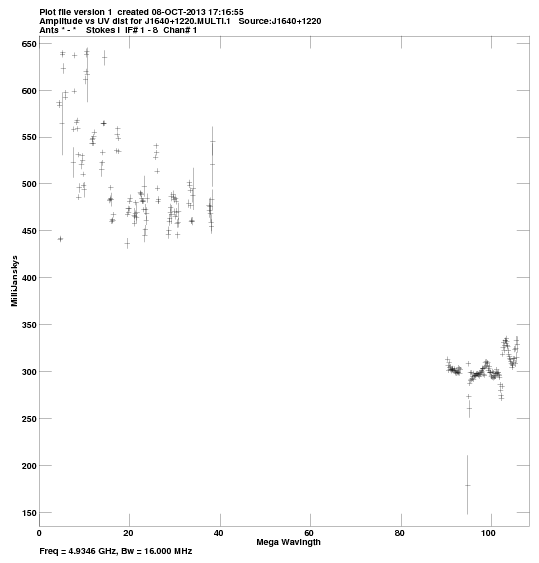
J1640+1220:
pdf
, or
png
.
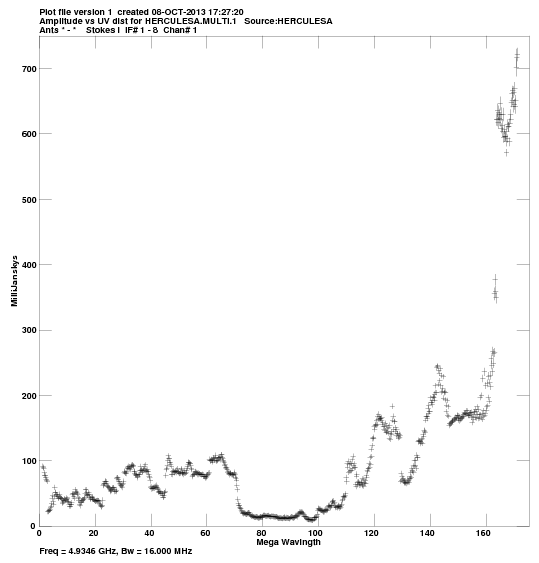
HERCULESA:
pdf
, or
png
.
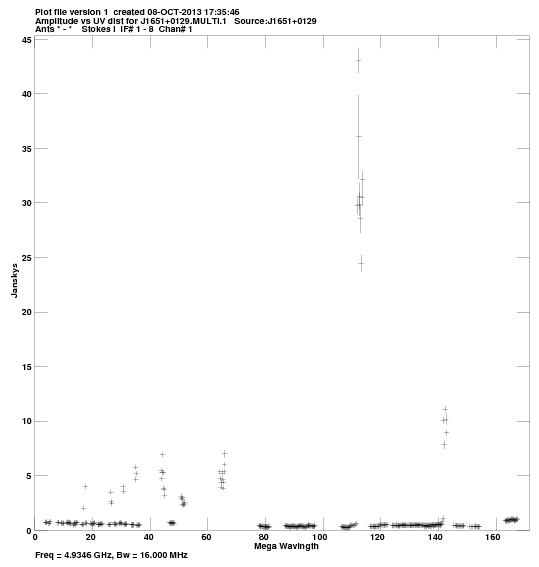
J1651+0129:
pdf
, or
png
.
Comments.
For each source, a plot of amp vs. |uv| distance. The phase-reference source and target have an unphysically high clump at large |uv|.
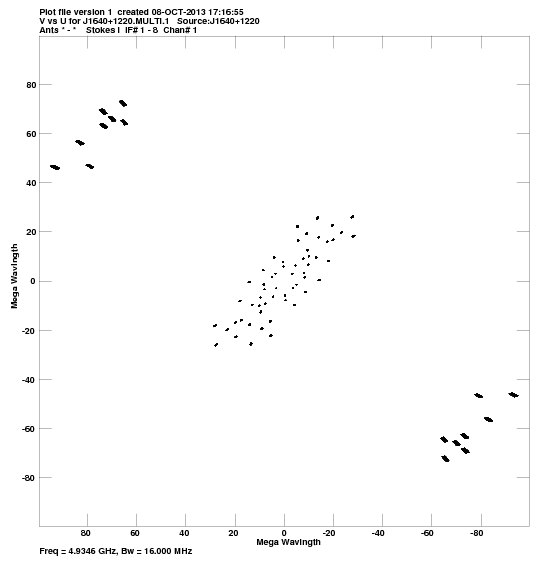
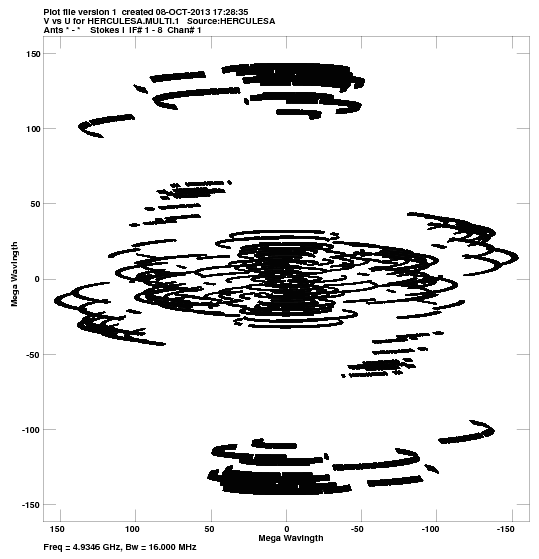
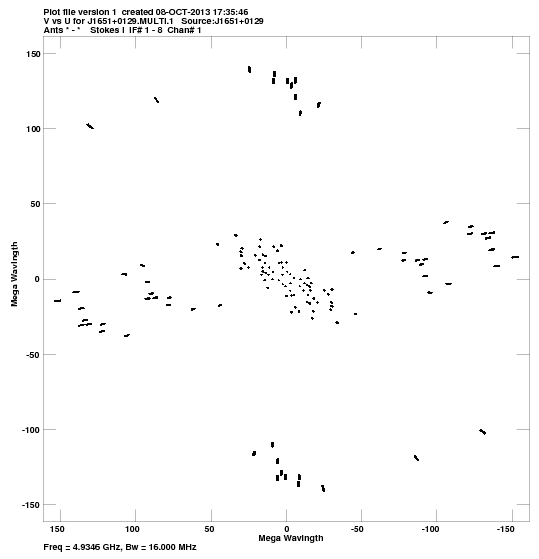
u,v coverage for:
J1649+0626:
pdf
, or
png
.
J1640+1220:
pdf
, or
png
.
HERCULESA:
pdf
, or
png
.
J1651+0129:
pdf
, or
png
.
Comments.
For each source, a plot of the u-v coverage.
Crude maps of sources:
J1649+0626:
pdf
, or
FITS
.
J1640+1220:
pdf
, or
FITS
.
HERCULESA:
pdf
, or
FITS
.
J1651+0129:
pdf
, or
FITS
.
Comments.
For each source, a CLEAN map resulting from the automated fringing and self-cal iterations (or phase-referencing) in the pipeline script. For this pipeline pass, an image size twice as large as usual was used because the structure for HERCULESA was near the edge of the default size. It is consistent with the L-band pipelining in EG072B.