
EVN User Experiment Pipeline Feedback
Last updated: Wed Jan 5 14:53:31 CET 2011
mahmud@jive.nl
General Comments.
(
Brief data summary
and
scan listing
)
EL040B had 8 stations: Tr Zc Ef Sv Mc Bd Wb Jb, 8 16 MHz IFs, dual polarization, and used 2s integrations. Considerably more information is included in the experiment's cover letter on the standard-plots portion of the EVN Archive. In the pipelining, the target sources 0800 and 0828 were treated as phase-referenced sources and not directly fringed. The SOLINT was set automatically at a representative length of a reference-source scan in a phase-reference cycle (~90s judging from the schedule). Ef was used as the reference station.
The EVN reliability indicator (ERI) for this experiment was
ERI = 0.72 . ERI* = 0.97 .
The losses included LL fringes in IFs 7&8 for Tr and no Onsala in the entire experiment due to high winds (Tr=0.875, Ef=1, Zc=1,Sv=1, Bd=1, Wb=1, Jb=1, On=0).
Plots of the autocorrelations
Comments.
Each scan plotted separately, all stations. Strong RFI in Bd IF 1, Zc IF 4, Mc IF 1,2 & 8
plots of the uncalibrated amplitude and phase
against time
Comments.
Full-experiment for Ef-* baselines, no calibration applied.
Plots of the uncalibrated amplitude and phase
against frequency channel
Comments.
Scalar averaged Ef-* baselines, each scan plotted separately. No calibration applied yet.
The uncalibrated amplitude and phase of the crosshand
correlations against frequency channel
(not available)
Comments.
Scalar averaged Ef-* baselines for LR, each scan plotted separately. No calibration applied yet.
TSYS against time
Comments.
TY1 table, each IF/pol on a separate plot. Noisy Tsys for Wb IF 2 & 3, Tsys very high for Mc IF 1 & 2.
Telescope sensitivities
from the a priori TSYS and Gain
curves (the square of this number gives the antenna noise (SEFD) in Jy - the
smaller the better).
Comments.
Gain amplitude from CL2 table.
Fringe-fit phase solutions
(including Parallactic
Angle correction).
Comments.
CL3 station phase solutions -- CL3 = CL2+SN2, thus also includes the initial amplitude/parallactic angle calibration from CL2 and the fringe solutions from SN2.
Fringe-fit delay solutions
Comments.
SN2 station delay solutions for the fringed sources, each IF/pol on a separate plot.
Fringe-fit rate solutions
Comments.
SN2 station rate solutions.
Telescope bandpasses
Comments.
Bandpass table 1. 4C39.25 was used for bandpass calibration.
Calibrated amplitude and phase against time
(a
priori amplitude calibration and fringe-fit solutions applied).
Comments.
Full-experiment for Ef-* baselines, calibrated with CL3.
Calibrated amplitude and phase against frequency
channel
Comments.
Ef-* baselines calibrated with CL3 and BP1. Tr RR IF 7&8 amplitudes very low, also for Bd and Sv IF 1. These should be flagged.
Naturally weighted dirty map (not useful for bright sources)
produced before self-cal of:
0800:
pdf
, or
FITS
.
4C39.25: pdf (not available)
, or
FITS (not available)
.
J0813+2435: pdf (not available)
, or
FITS (not available)
.
0828:
pdf
, or
FITS
.
J0819+3226: pdf (not available)
, or
FITS (not available)
.
Comments.
Naturually weighted dirty map of the targets.
Uniformly weighted dirty map (not useful for bright sources)
produced before self-cal of:
0800:
pdf
, or
FITS
.
4C39.25: pdf (not available)
, or
FITS (not available)
.
J0813+2435: pdf (not available)
, or
FITS (not available)
.
0828:
pdf
, or
FITS
.
J0819+3226: pdf (not available)
, or
FITS (not available)
.
Comments.
Uniformly weighted dirty map of the targets.
Phase corrections applied to a priori calibrated and
fringe-fitted data by self-calibration.
0800 (not available)
.
4C39.25
.
J0813+2435
.
0828 (not available)
.
J0819+3226
.
Comments.
Plots of post-SPLIT tables SN1 for the sources.
Amplitude corrections applied to a priori calibrated and
fringe-fitted data by self-calibration.
0800: pdf (not available)
, or
text file (not available)
, or
statistical summary (not available)
.
4C39.25:
pdf
, or
text file
, or
statistical summary
.
J0813+2435:
pdf
, or
text file
, or
statistical summary
.
0828: pdf (not available)
, or
text file (not available)
, or
statistical summary (not available)
.
J0819+3226:
pdf
, or
text file
, or
statistical summary
.
Comments.
As above, but for the post-SPLIT table SN2.
Telescope sensitivities
(the total AMP gain applied
during both a priori and self calibration; the square of this number gives the
antenna noise (SEFD) in Jy).
Comments.
CL4 gain-amp.
Residual closure phase (visibility closure phase with model closure phase subtracted) for:
0800 (not available)
.
4C39.25
.
J0813+2435
.
0828 (not available)
.
J0819+3226
.
Comments.
Separate files per (fringed) source, showing closure phase plots for all the triangles (not just Ef-*-*). Only stokes=I shown.
Calibrated visibilities and the source model of:
0800 (not available)
.
4C39.25
.
J0813+2435
.
0828 (not available)
.
J0819+3226
.
Comments.
For each (fringed) source, plots of amp/phase on Ef-* baselines, calibrated with (post-SPLIT) table CL3, with a model-line overplotted.
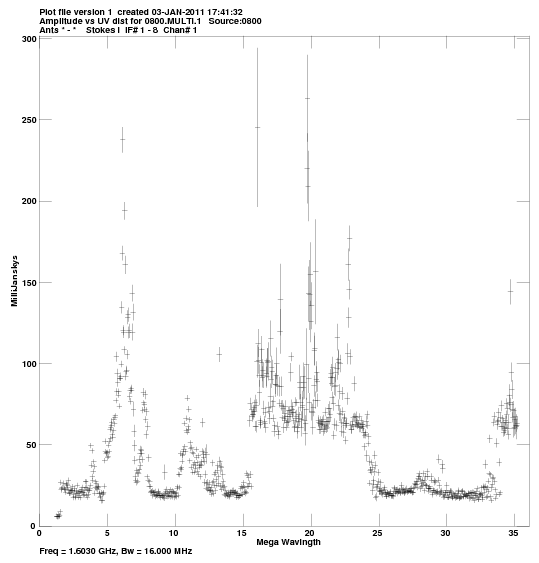
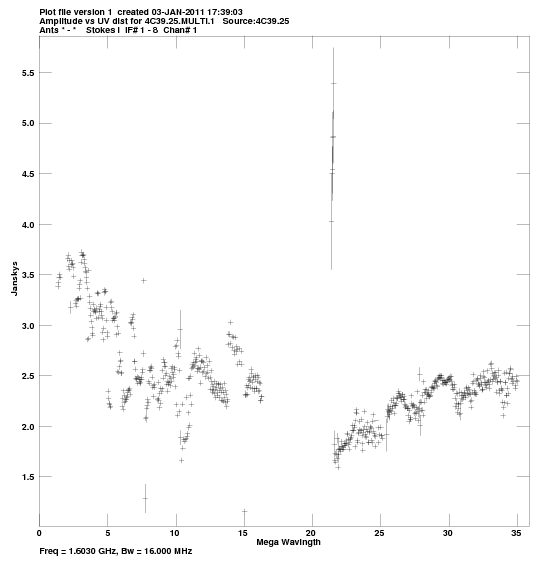
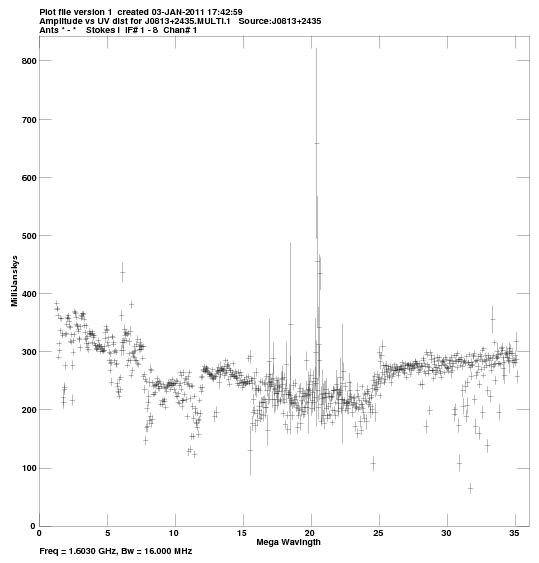
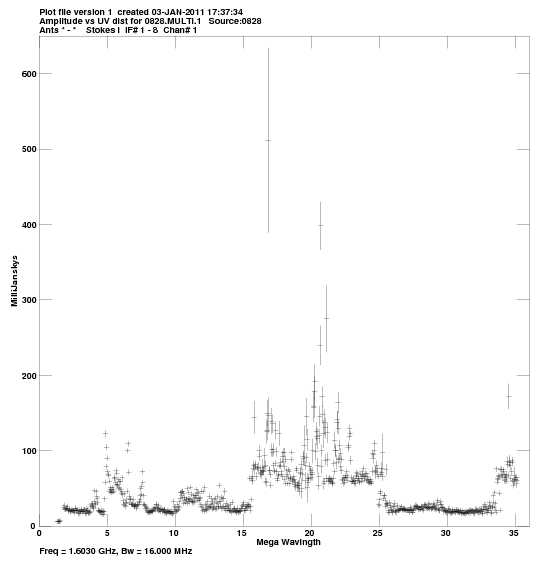
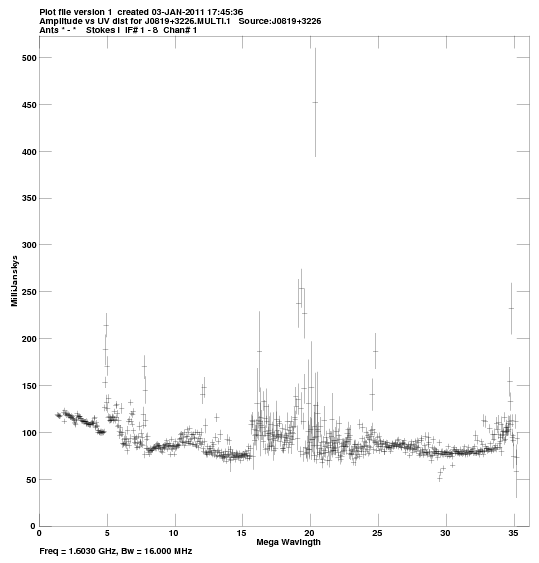
Calibrated visibilities against u,v distance for:
0800:
pdf
, or
png
.
4C39.25:
pdf
, or
png
.
J0813+2435:
pdf
, or
png
.
0828:
pdf
, or
png
.
J0819+3226:
pdf
, or
png
.
Comments.
For each source, a plot of amp vs. |uv| distance.
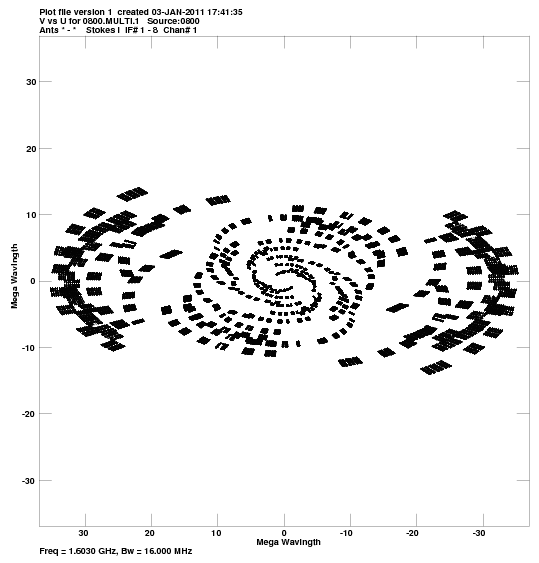
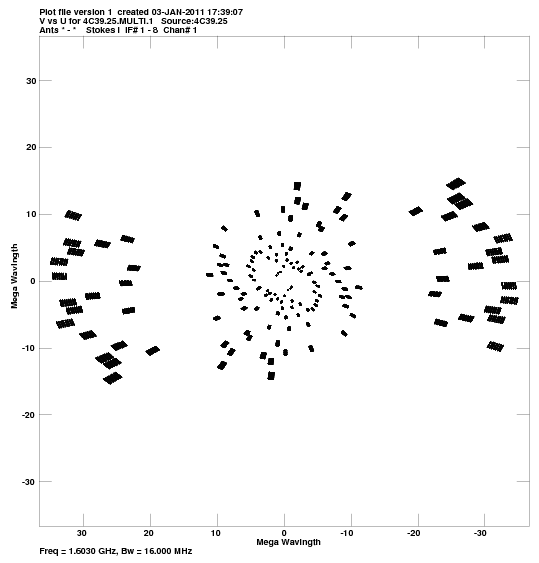
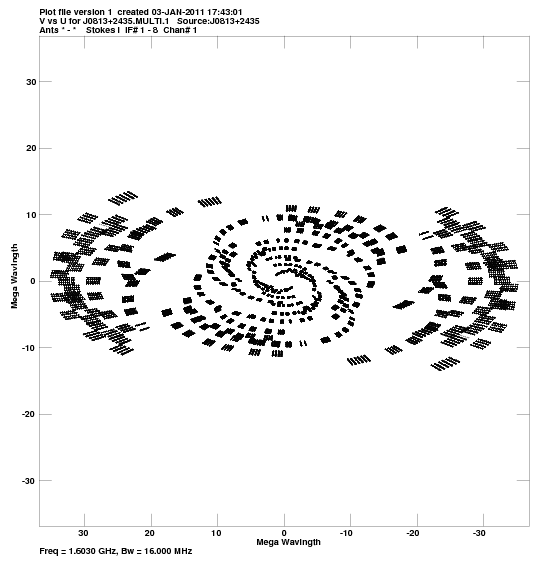
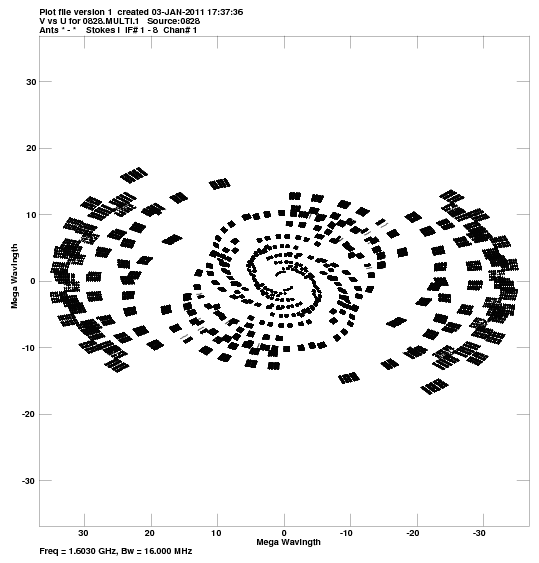
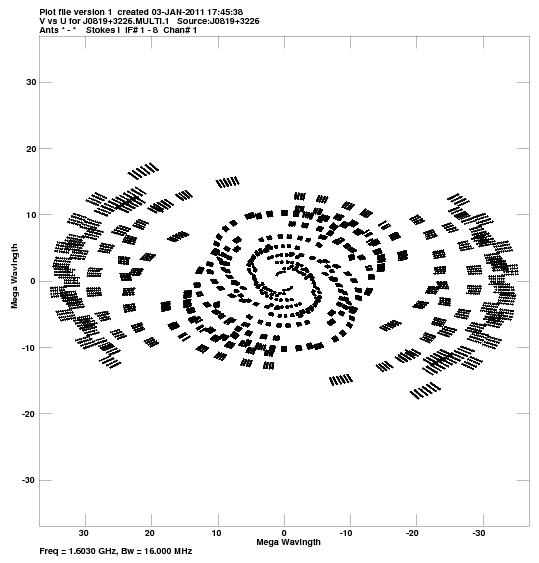
u,v coverage for:
0800:
pdf
, or
png
.
4C39.25:
pdf
, or
png
.
J0813+2435:
pdf
, or
png
.
0828:
pdf
, or
png
.
J0819+3226:
pdf
, or
png
.
Comments.
For each source, a plot of the u-v coverage.
Crude maps of sources:
0800:
pdf
, or
FITS
.
4C39.25:
pdf
, or
FITS
.
J0813+2435:
pdf
, or
FITS
.
0828:
pdf
, or
FITS
.
J0819+3226:
pdf
, or
FITS
.
Comments.
For each source, a CLEAN map resulting from the automated fringing and self-cal iterations (or phase-referencing) in the pipeline script.