
EVN User Experiment Pipeline Feedback
Last updated: Fri Jun 10 16:57:49 CEST 2011
yang@jive.nl
General Comments.
(
Brief data summary
and
scan listing
)
The X band user experiment EM085 was performed on 15 March 2010. The experiment used 11 stations with a recording data rate of 1024 Mbps (16 x 16 MHz, 2bit sampling, RCP only). Ef, Wb, and Mc are used as the reference station in the pipelining data reduction.
The EVN reliability indicator (ERI) for this experiment was
ERI = 0.94 . ERI* = 0.94 .
(Ef=1, Wb=1, Mc=0.66, On=1, Hh=1, Ys=1, Bd=1, Zc=1, Sv=1, Ur=1, Sh=1).
Plots of the autocorrelations
Comments.
Each scan plotted separately, all stations.
plots of the uncalibrated amplitude and phase
against time
Comments.
Full-experiment for Ef-* baselines, no calibration applied.
Plots of the uncalibrated amplitude and phase
against frequency channel
Comments.
Scalar averaged Ef-* baselines, each scan plotted separately. No calibration applied yet.
The uncalibrated amplitude and phase of the crosshand
correlations against frequency channel
(not available)
Comments.
TSYS against time
Comments.
TY1 table, each IF/pol on a separate plot.
Telescope sensitivities
from the a priori TSYS and Gain
curves (the square of this number gives the antenna noise (SEFD) in Jy - the
smaller the better).
Comments.
Gain amplitude from CL2 table.
Fringe-fit phase solutions
(including Parallactic
Angle correction).
Comments.
FRING_PHAS CL3 station phase solutions -- CL3 = CL2+SN2, thus also includes the initial amplitude/parallactic angle calibration from CL2 and the fringe solutions from SN2.
Fringe-fit delay solutions
Comments.
SN2 station delay solutions for the fringed sources, each IF/pol on a separate plot.
Fringe-fit rate solutions
Comments.
SN2 station rate solutions.
Telescope bandpasses
Comments.
Bandpass table 1.
Calibrated amplitude and phase against time
(a
priori amplitude calibration and fringe-fit solutions applied).
Comments.
Full-experiment for Ef-* baselines, calibrated with CL3.
Calibrated amplitude and phase against frequency
channel
Comments.
Ef-* baselines calibrated with CL3 and BP1. The amp and phase plots self-scale, not necessarily going down to 0 in the case of the amps.
Naturally weighted dirty map (not useful for bright sources)
produced before self-cal of:
J1827-1408:
pdf
, or
FITS
.
J1844-1324: pdf (not available)
, or
FITS (not available)
.
J1825-1449A:
pdf
, or
FITS
.
J1835-1115: pdf (not available)
, or
FITS (not available)
.
J1822-1309:
pdf
, or
FITS
.
J1733-1304: pdf (not available)
, or
FITS (not available)
.
J1825-1718: pdf (not available)
, or
FITS (not available)
.
LS5039:
pdf
, or
FITS
.
K1825-1449B:
pdf
, or
FITS
.
J1819-1419:
pdf
, or
FITS
.
Comments.
Uniformly weighted dirty map (not useful for bright sources)
produced before self-cal of:
J1827-1408:
pdf
, or
FITS
.
J1844-1324: pdf (not available)
, or
FITS (not available)
.
J1825-1449A:
pdf
, or
FITS
.
J1835-1115: pdf (not available)
, or
FITS (not available)
.
J1822-1309:
pdf
, or
FITS
.
J1733-1304: pdf (not available)
, or
FITS (not available)
.
J1825-1718: pdf (not available)
, or
FITS (not available)
.
LS5039:
pdf
, or
FITS
.
K1825-1449B:
pdf
, or
FITS
.
J1819-1419:
pdf
, or
FITS
.
Comments.
Phase corrections applied to a priori calibrated and
fringe-fitted data by self-calibration.
J1827-1408 (not available)
.
J1844-1324
.
J1825-1449A (not available)
.
J1835-1115
.
J1822-1309 (not available)
.
J1733-1304
.
J1825-1718
.
LS5039 (not available)
.
K1825-1449B (not available)
.
J1819-1419 (not available)
.
Comments.
Plots of post-SPLIT tables SN1 for the sources.
Amplitude corrections applied to a priori calibrated and
fringe-fitted data by self-calibration.
J1827-1408: pdf (not available)
, or
text file (not available)
, or
statistical summary (not available)
.
J1844-1324:
pdf
, or
text file
, or
statistical summary
.
J1825-1449A: pdf (not available)
, or
text file (not available)
, or
statistical summary (not available)
.
J1835-1115:
pdf
, or
text file
, or
statistical summary
.
J1822-1309: pdf (not available)
, or
text file (not available)
, or
statistical summary (not available)
.
J1733-1304:
pdf
, or
text file
, or
statistical summary
.
J1825-1718:
pdf
, or
text file
, or
statistical summary
.
LS5039: pdf (not available)
, or
text file (not available)
, or
statistical summary (not available)
.
K1825-1449B: pdf (not available)
, or
text file (not available)
, or
statistical summary (not available)
.
J1819-1419: pdf (not available)
, or
text file (not available)
, or
statistical summary (not available)
.
Comments.
As above, but for the post-SPLIT table SN2.
Telescope sensitivities
(the total AMP gain applied
during both a priori and self calibration; the square of this number gives the
antenna noise (SEFD) in Jy).
Comments.
Residual closure phase (visibility closure phase with model closure phase subtracted) for:
J1827-1408 (not available)
.
J1844-1324
.
J1825-1449A (not available)
.
J1835-1115
.
J1822-1309 (not available)
.
J1733-1304
.
J1825-1718
.
LS5039 (not available)
.
K1825-1449B (not available)
.
J1819-1419 (not available)
.
Comments.
Separate files per (fringed) source, showing closure phase plots for all the triangles (not just Ef-*-*). Only stokes=I shown.
Calibrated visibilities and the source model of:
J1827-1408 (not available)
.
J1844-1324
.
J1825-1449A (not available)
.
J1835-1115
.
J1822-1309 (not available)
.
J1733-1304
.
J1825-1718
.
LS5039 (not available)
.
K1825-1449B (not available)
.
J1819-1419 (not available)
.
Comments.
For each (fringed) source, plots of amp/phase on Ef-* baselines, calibrated with (post-SPLIT) table CL3, with a model-line overplotted.
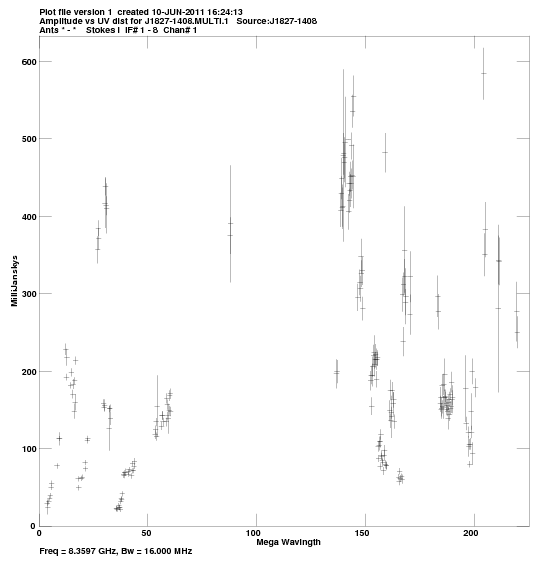
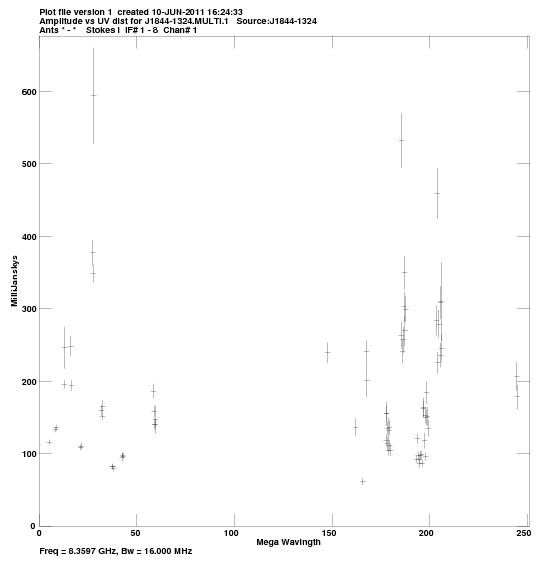
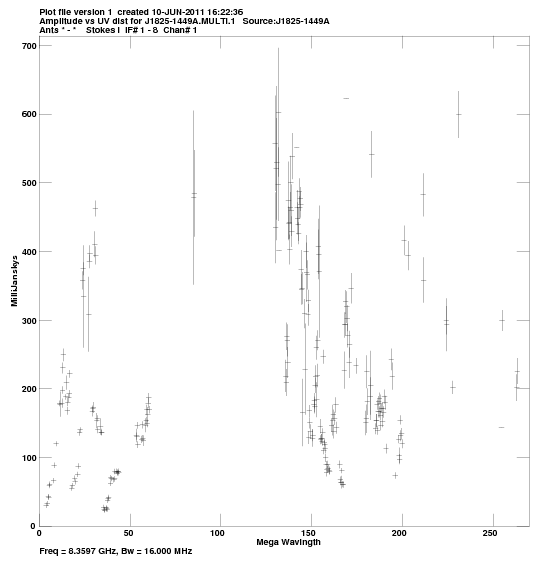
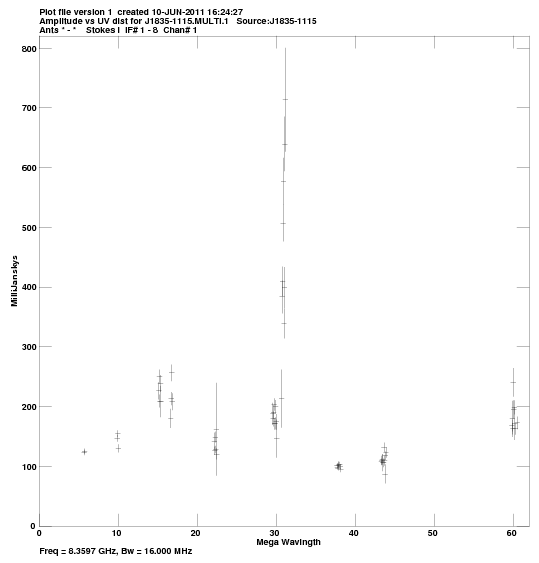
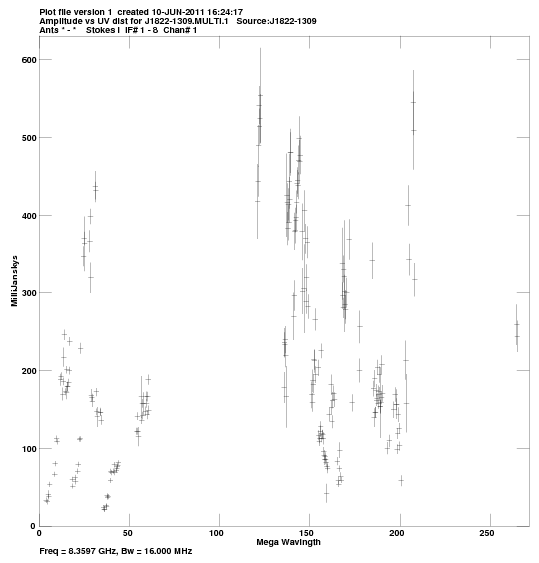
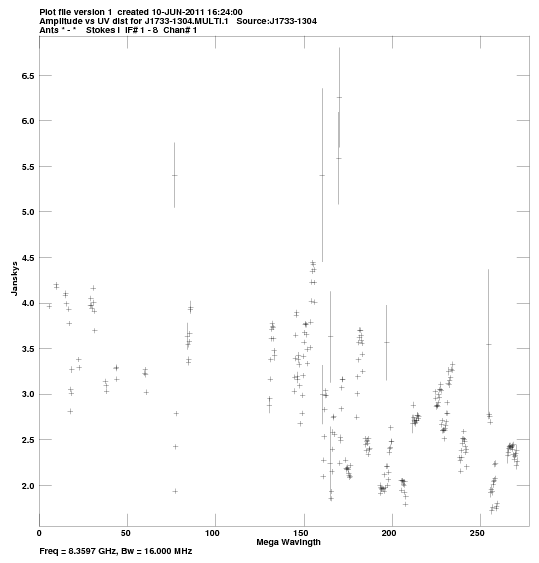
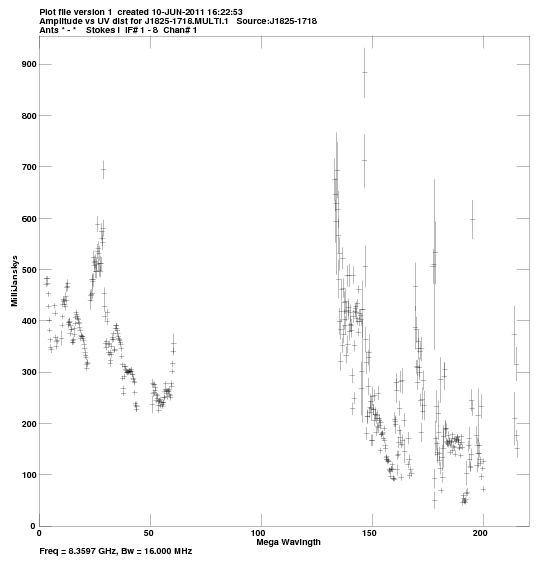
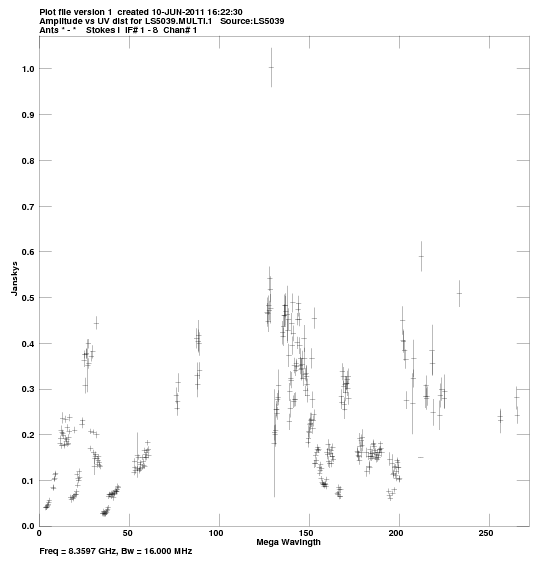
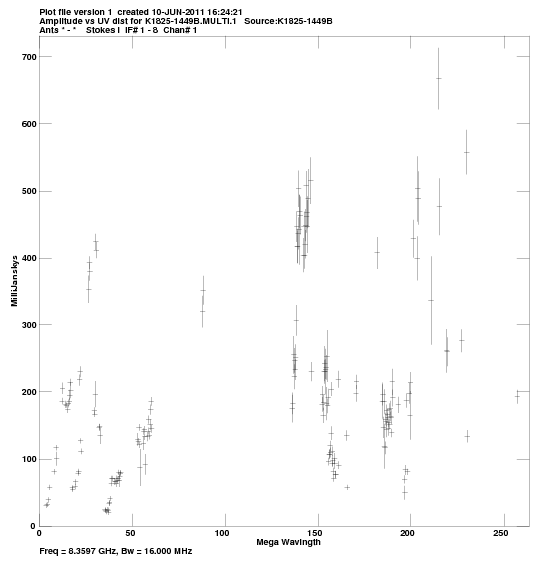
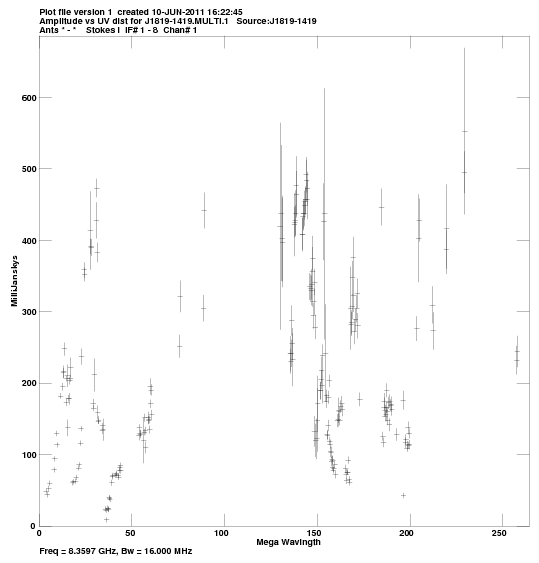
Calibrated visibilities against u,v distance for:
J1827-1408:
pdf
, or
png
.
J1844-1324:
pdf
, or
png
.
J1825-1449A:
pdf
, or
png
.
J1835-1115:
pdf
, or
png
.
J1822-1309:
pdf
, or
png
.
J1733-1304:
pdf
, or
png
.
J1825-1718:
pdf
, or
png
.
LS5039:
pdf
, or
png
.
K1825-1449B:
pdf
, or
png
.
J1819-1419:
pdf
, or
png
.
Comments.
For each source, a plot of amp vs. |uv| distance at X band.
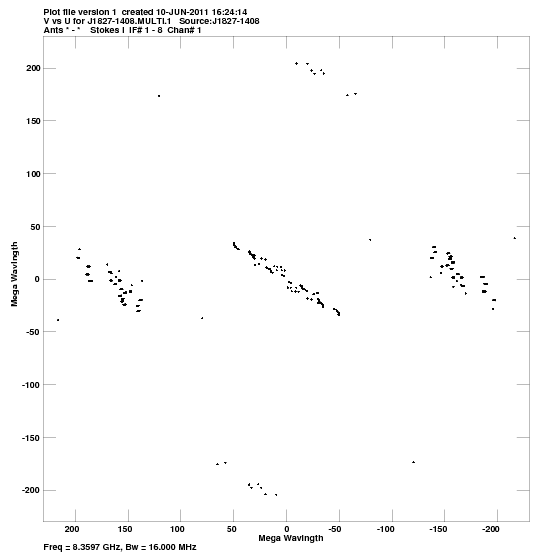
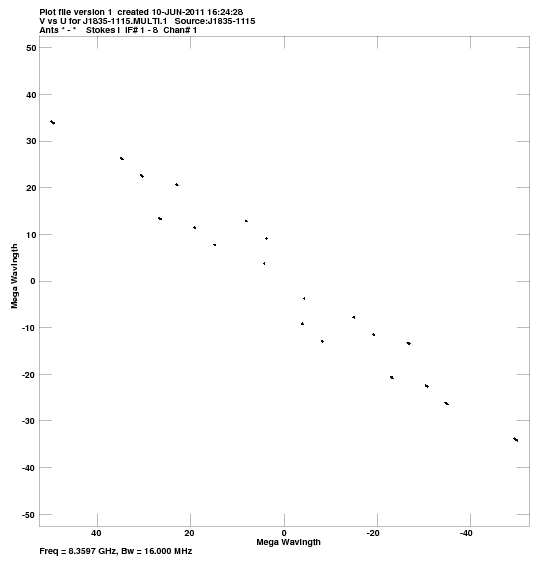
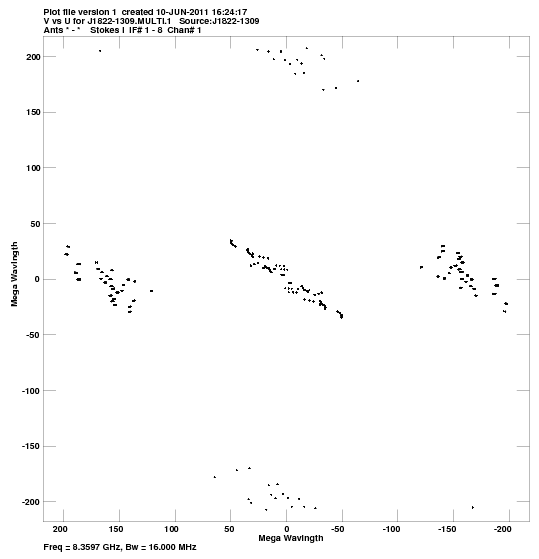
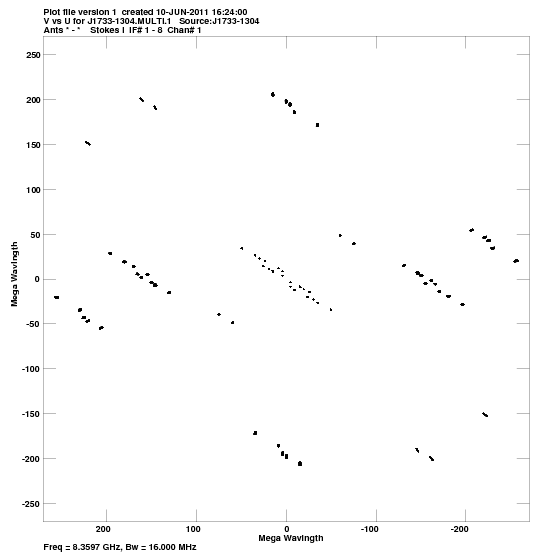
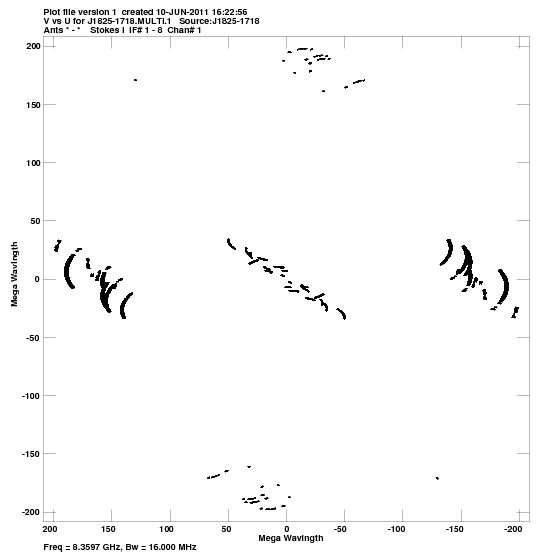
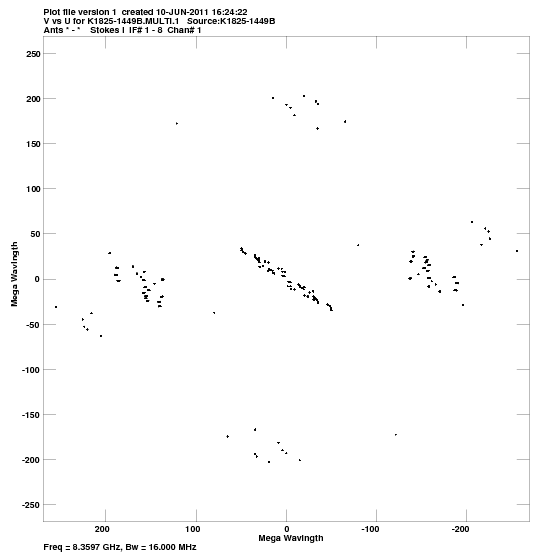
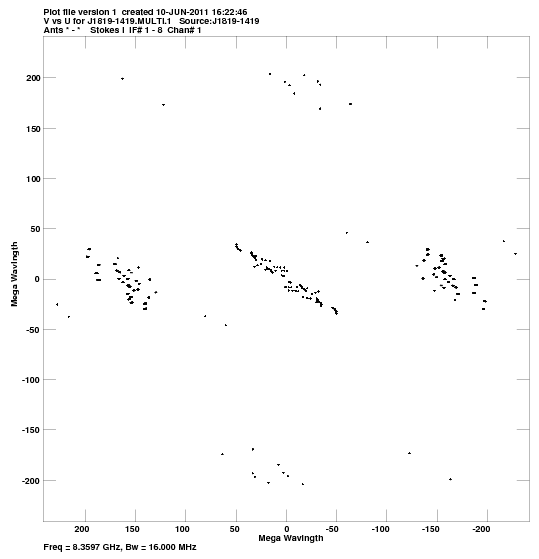
u,v coverage for:
J1827-1408:
pdf
, or
png
.
J1844-1324:
pdf
, or
png
.
J1825-1449A:
pdf
, or
png
.
J1835-1115:
pdf
, or
png
.
J1822-1309:
pdf
, or
png
.
J1733-1304:
pdf
, or
png
.
J1825-1718:
pdf
, or
png
.
LS5039:
pdf
, or
png
.
K1825-1449B:
pdf
, or
png
.
J1819-1419:
pdf
, or
png
.
Comments.
For each source, a plot of the u-v coverage.
Crude maps of sources:
J1827-1408:
pdf
, or
FITS
.
J1844-1324:
pdf
, or
FITS
.
J1825-1449A:
pdf
, or
FITS
.
J1835-1115:
pdf
, or
FITS
.
J1822-1309:
pdf
, or
FITS
.
J1733-1304:
pdf
, or
FITS
.
J1825-1718:
pdf
, or
FITS
.
LS5039:
pdf
, or
FITS
.
K1825-1449B:
pdf
, or
FITS
.
J1819-1419:
pdf
, or
FITS
.
Comments.