
EVN User Experiment Pipeline Feedback
Last updated: Tue Jul 2 13:27:31 CEST 2013
surcis@jive.nl
General Comments.
(
Brief data summary
and
scan listing
)
L band phase-referencing experiment, observed on 13 March 2013. Data rate was 1 Gbps (8 X 16 MHz subbands, dual polarization, two-bit sampling). The target source 'J1130+0058' was calibrated using the phase-reference source 'J1130+0040'. 'J1058+0133' was the fringe finder and bandpass calibrator. Participating telescopes were Jodrell Bank, Westerbork, Onsala, Medicina, Noto, Torun, Svetloe, Zelenchukskaya, Badary, Urumqi, Shanghai, Hartebeesthoek. Medicina observed at 512 Mbps (but used 1-bit sampling to recover the full bandwidth).
The EVN reliability indicator (ERI) for this experiment was
ERI = 0.78 . ERI* = 0.78 .
(Ef=0 (snow), Jb=1, Wb=1, On=1, Mc=1, Nt=1, Tr=1, Sv=1, Zc=0.85, Bd=0.67, Ur=1, Sh=1, Hh=1)
Plots of the autocorrelations
Comments.
Each scan plotted separately, all stations. Several strong RFIs in almost all antennas.
plots of the uncalibrated amplitude and phase
against time
Comments.
Full-experiment on Wb-* baselines, no calibration applied. A 1.0-minute plot-averaging was used.
Plots of the uncalibrated amplitude and phase
against frequency channel
Comments.
Scalar averaged Wb-* baselines, each scan plotted separately. No calibration applied yet. RFIs in some baseline (e.g., Jb-Wb, Wb-On, Wb-Tr, Wb-Sv, Wb-Zc, Wb-Ur, Wb-Hh).
The uncalibrated amplitude and phase of the crosshand
correlations against frequency channel
(not available)
Comments.
Scalar averaged Wb-* baselines for LR, each scan plotted separately. No calibration applied yet.
TSYS against time
Comments.
TY1 table.
Telescope sensitivities
from the a priori TSYS and Gain
curves (the square of this number gives the antenna noise (SEFD) in Jy - the
smaller the better).
Comments.
Gain amplitude from CL2 table.
Fringe-fit phase solutions
(including Parallactic
Angle correction).
Comments.
CL3 station phase solutions -- CL3 = CL2+SN2, thus also includes the initial amplitude/parallactic angle calibration from CL2 and the fringe solutions from SN2.
Fringe-fit delay solutions
Comments.
SN2 station delay solutions for the fringed sources.
Fringe-fit rate solutions
Comments.
SN2 station rate solutions.
Telescope bandpasses
Comments.
Bandpass table 1.
Calibrated amplitude and phase against time
(a
priori amplitude calibration and fringe-fit solutions applied).
Comments.
Full-experiment for Wb-* baselines, calibrated with CL3.
Calibrated amplitude and phase against frequency
channel
Comments.
Ef-* baselines calibrated with CL3 and BP1.
Naturally weighted dirty map (not useful for bright sources)
produced before self-cal of:
J1133+0040: pdf (not available)
, or
FITS (not available)
.
J1130+0058:
pdf
, or
FITS
.
J1058+0133: pdf (not available)
, or
FITS (not available)
.
Comments.
Uniformly weighted dirty map (not useful for bright sources)
produced before self-cal of:
J1133+0040: pdf (not available)
, or
FITS (not available)
.
J1130+0058:
pdf
, or
FITS
.
J1058+0133: pdf (not available)
, or
FITS (not available)
.
Comments.
Phase corrections applied to a priori calibrated and
fringe-fitted data by self-calibration.
J1133+0040
.
J1130+0058 (not available)
.
J1058+0133
.
Comments.
Plots of post-SPLIT tables SN1 for the sources.
Amplitude corrections applied to a priori calibrated and
fringe-fitted data by self-calibration.
J1133+0040:
pdf
, or
text file
, or
statistical summary
.
J1130+0058: pdf (not available)
, or
text file (not available)
, or
statistical summary (not available)
.
J1058+0133:
pdf
, or
text file
, or
statistical summary
.
Comments.
As above, but for the post-SPLIT table SN2.
Telescope sensitivities
(the total AMP gain applied
during both a priori and self calibration; the square of this number gives the
antenna noise (SEFD) in Jy).
Comments.
CL4 gain-amp.
Residual closure phase (visibility closure phase with model closure phase subtracted) for:
J1133+0040
.
J1130+0058 (not available)
.
J1058+0133
.
Comments.
Separate files per (fringed) source, showing closure phase plots for all the triangles (not just Wb-*-*). Only stokes=I shown.
Calibrated visibilities and the source model of:
J1133+0040
.
J1130+0058 (not available)
.
J1058+0133
.
Comments.
For the fringed source, plots of amp/phase on Wb-* baselines, calibrated with (post-SPLIT) table CL3, with a model-line overplotted.
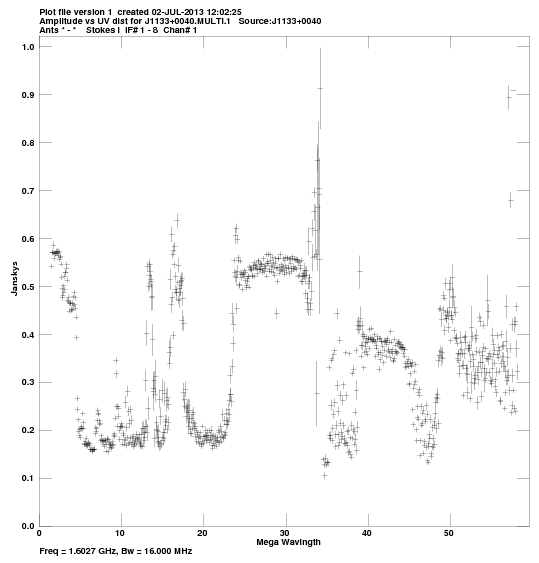
Calibrated visibilities against u,v distance for:
J1133+0040:
pdf
, or
png
.
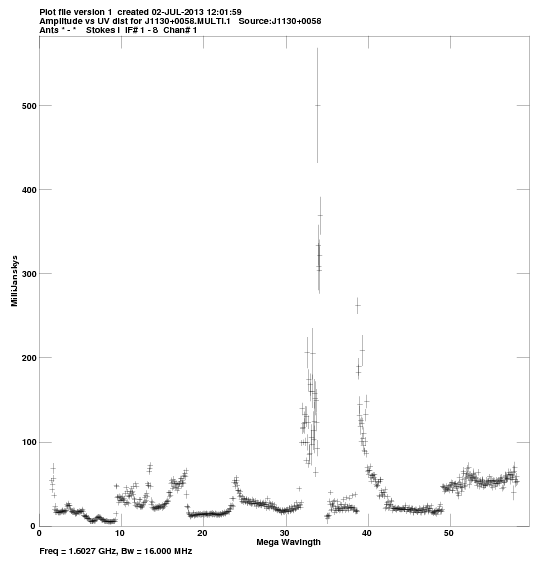
J1130+0058:
pdf
, or
png
.
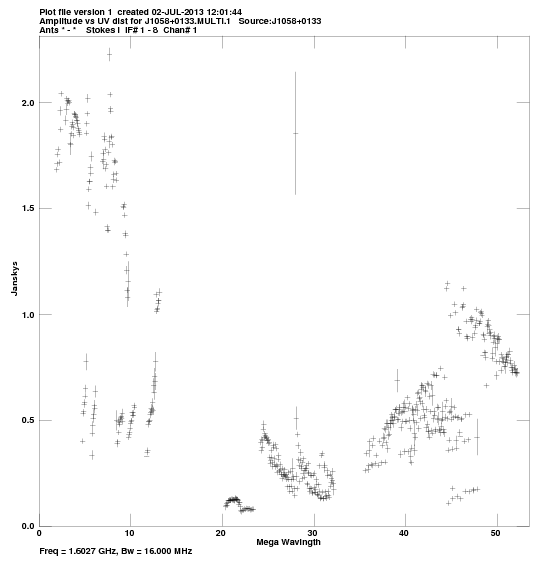
J1058+0133:
pdf
, or
png
.
Comments.
For each source, a plot of amp vs. |uv| distance.
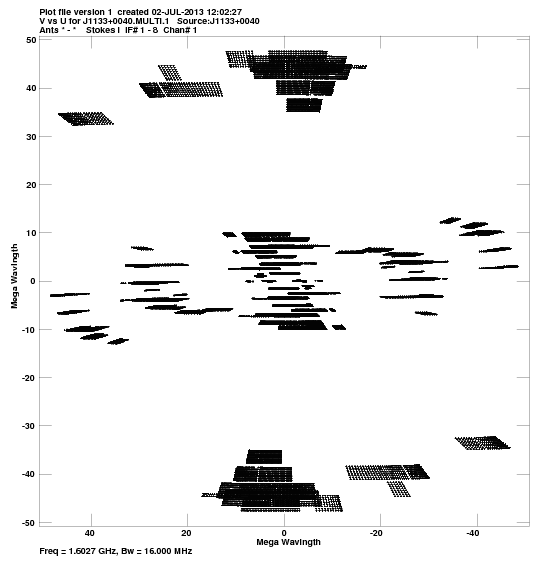
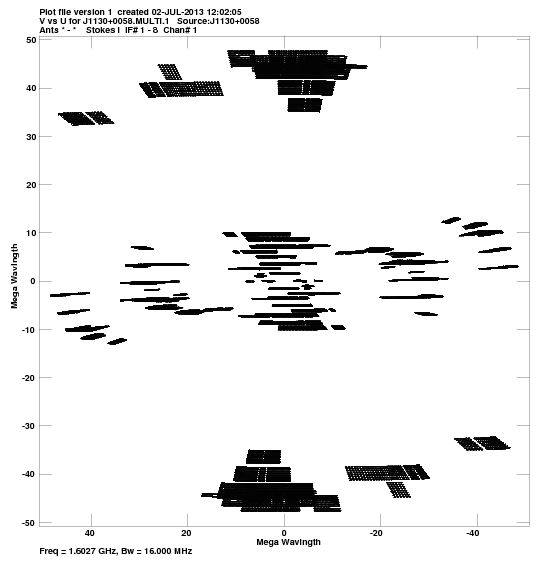
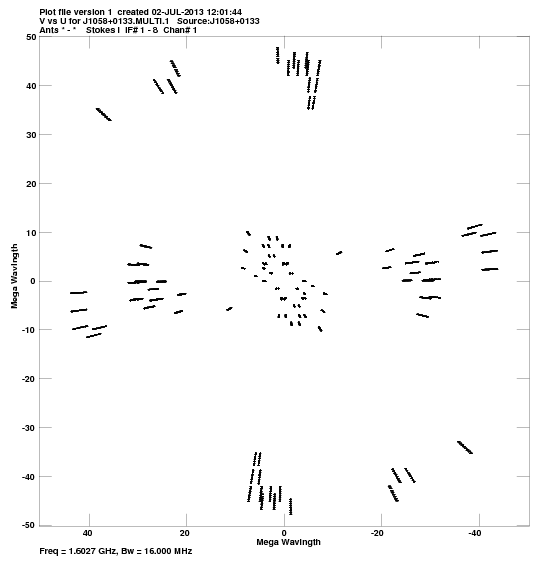
u,v coverage for:
J1133+0040:
pdf
, or
png
.
J1130+0058:
pdf
, or
png
.
J1058+0133:
pdf
, or
png
.
Comments.
For each source, a plot of the u-v coverage.
Crude maps of sources:
J1133+0040:
pdf
, or
FITS
.
J1130+0058:
pdf
, or
FITS
.
J1058+0133:
pdf
, or
FITS
.
Comments.
For each source, a CLEAN map resulting from the automated fringing and self-cal iterations in the pipeline script.