
EVN User Experiment Pipeline Feedback
Last updated: Tue Aug 9 15:19:44 CEST 2016
blanchard@jive.eu
General Comments.
(
Brief data summary
and
scan listing
)
ES079A, C-band VLBI experiment on 2016 February 26 for the continuum pass. ES079A had 10 good stations, 8, 4 MHz IFs, 2 polarizations, 32 frequency points per IF/pol, and 1s integrations. Participating telescopes were Effelsberg, Jodrell Bank (MkII), Westerbork (single dish), Medicina, Noto, Onsala, Torun, Yebes, Sardinia, Irbene. Ef was used as reference.
The EVN reliability indicator (ERI) for this experiment was
ERI = 0.93 . ERI* = 0.93 .
(Ef=1, Wb=1, Jb=1, Mc=1, O8=1, Nt=0.99, Tr=1, Ys=1, Sr=1) Counting losses: NT missed 6 minutes. Not counting Ir as not EVN station. Note Ir missed all scans until scan 76.
Plots of the autocorrelations
Comments.
Each scan plotted separately, all stations.
Plots of the uncalibrated amplitude and phase
against time
Comments.
Full-experiment for Ef-* baselines, no calibration applied. Note Nt missing ~ 09:36 - 09:41
Plots of the uncalibrated amplitude and phase
against frequency channel
Comments.
Scalar averaged Ef-* baselines, each scan plotted separately. No calibration applied yet. Note EF has a bad sub-band 5 (sb 4 in 0 counting).
The uncalibrated amplitude and phase of the crosshand
correlations against frequency channel
(not available)
Comments.
Scalar averaged Ef-* baselines showing LR, each scan plotted separately. No calibration applied yet.
TSYS against time
Comments.
TY1 table, each IF/pol on a separate plot. Note IR does not provide TSYS at this time so nominal values have been used, a flat GC has also been applied.
Telescope sensitivities
from the a priori TSYS and Gain
curves (the square of this number gives the antenna noise (SEFD) in Jy - the
smaller the better).
Comments.
Gain amplitude from CL2 table.
Fringe-fit phase solutions
(including Parallactic
Angle correction).
Comments.
CL3 station phase solutions -- CL3 = CL2+SN2, thus also includes the initial amplitude/parallactic angle calibration from CL2 and the fringe solutions from SN2.
Fringe-fit delay solutions
Comments.
SN2 station delay solutions for the fringed sources, each IF/pol on a separate plot.
Fringe-fit rate solutions
Comments.
SN2 station rate solutions.
Telescope bandpasses
Comments.
Bandpass table 1. 3C345 and 3C454.3 were used for bandpass calibration. Note Irbene was not observing for either of these sources. Suggest trying bandpass calibration on the reference for detailed analysis. For future reference we recommend more than 1 time period for bandpass calibration for this reason.
Calibrated amplitude and phase against time
(a
priori amplitude calibration and fringe-fit solutions applied).
Comments.
Full-experiment for Ef-* baselines, calibrated with CL3.
Calibrated amplitude and phase against frequency
channel
Comments.
Ef-* baselines calibrated with CL3 and BP1. The amp and phase plots self-scale, not necessarily going down to 0 in the case of the amps. Note EF has a bad sub-band 5 (sb 4 in 0 counting).
Naturally weighted dirty map (not useful for bright sources)
produced before self-cal of:
G107.29:
pdf
, or
FITS
.
3C454.3: pdf (not available)
, or
FITS (not available)
.
J2223+6249: pdf (not available)
, or
FITS (not available)
.
3C345: pdf (not available)
, or
FITS (not available)
.
Comments.
Naturally-weighted dirty maps of the phase-referenced-to sources (none here).
Uniformly weighted dirty map (not useful for bright sources)
produced before self-cal of:
G107.29:
pdf
, or
FITS
.
3C454.3: pdf (not available)
, or
FITS (not available)
.
J2223+6249: pdf (not available)
, or
FITS (not available)
.
3C345: pdf (not available)
, or
FITS (not available)
.
Comments.
Uniformly-weighted dirty maps of the phase-referenced-to sources (none here).
Phase corrections applied to a priori calibrated and
fringe-fitted data by self-calibration.
G107.29 (not available)
.
3C454.3
.
J2223+6249
.
3C345
.
Comments.
Plots of post-SPLIT tables SN1 for the sources that have been individually fringed.
Amplitude corrections applied to a priori calibrated and
fringe-fitted data by self-calibration.
G107.29: pdf (not available)
, or
text file (not available)
, or
statistical summary (not available)
.
3C454.3:
pdf
, or
text file
, or
statistical summary
.
J2223+6249:
pdf
, or
text file
, or
statistical summary
.
3C345:
pdf
, or
text file
, or
statistical summary
.
Comments.
As above, but for the post-SPLIT table SN2.
Telescope sensitivities
(the total AMP gain applied
during both a priori and self calibration; the square of this number gives the
antenna noise (SEFD) in Jy).
Comments.
CL4 gain-amp.
Residual closure phase (visibility closure phase with model closure phase subtracted) for:
G107.29 (not available)
.
3C454.3
.
J2223+6249
.
3C345
.
Comments.
Separate files per (fringed) source, showing closure phase plots for all the triangles. Only stokes=I shown.
Calibrated visibilities and the source model of:
G107.29 (not available)
.
3C454.3
.
J2223+6249
.
3C345
.
Comments.
For each (fringed) source, plots of amp/phase on Ef-* baselines, calibrated with (post-SPLIT) table CL3, with a model-line overplotted.
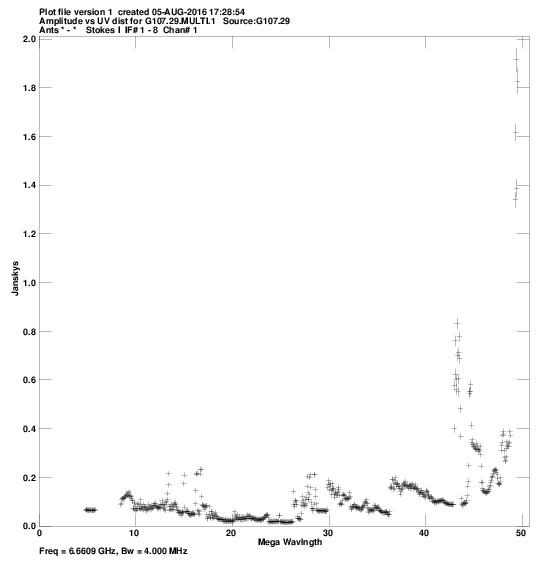
Calibrated visibilities against u,v distance for:
G107.29:
pdf
, or
png
.
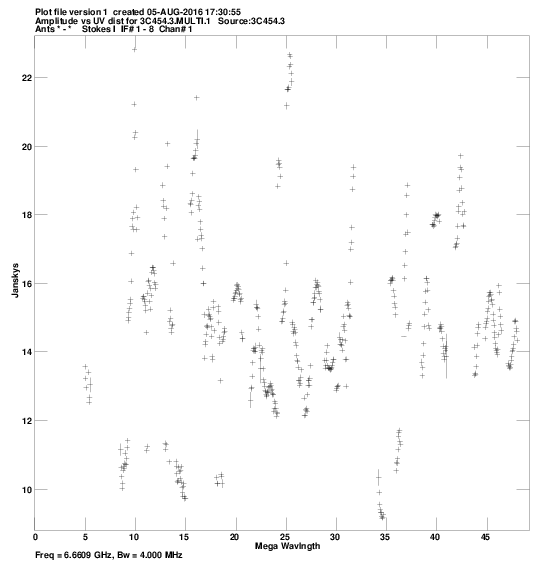
3C454.3:
pdf
, or
png
.
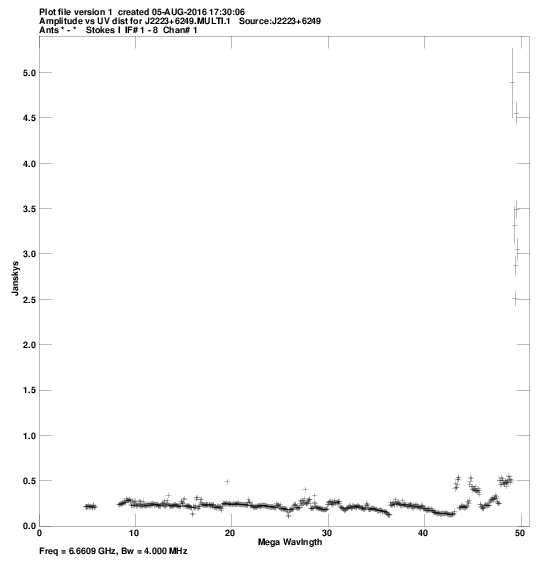
J2223+6249:
pdf
, or
png
.
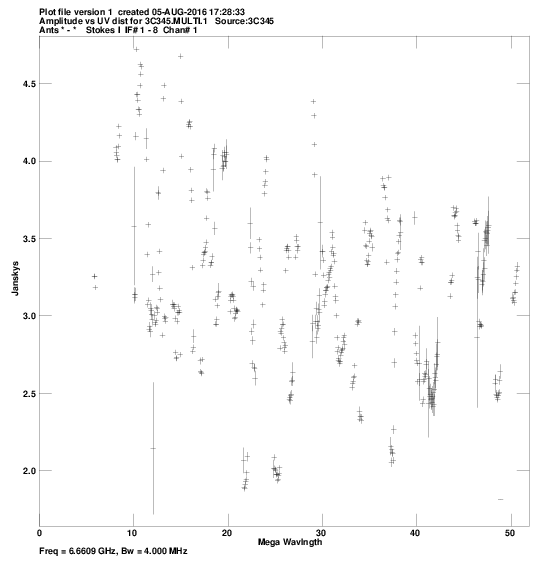
3C345:
pdf
, or
png
.
Comments.
For each source, a plot of amp vs. |uv| distance.
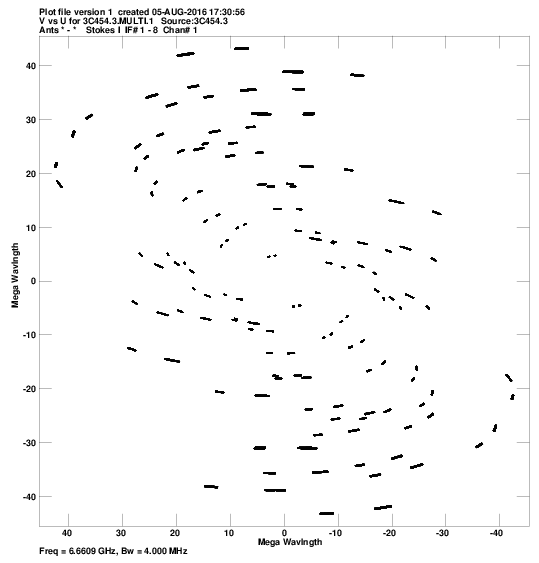
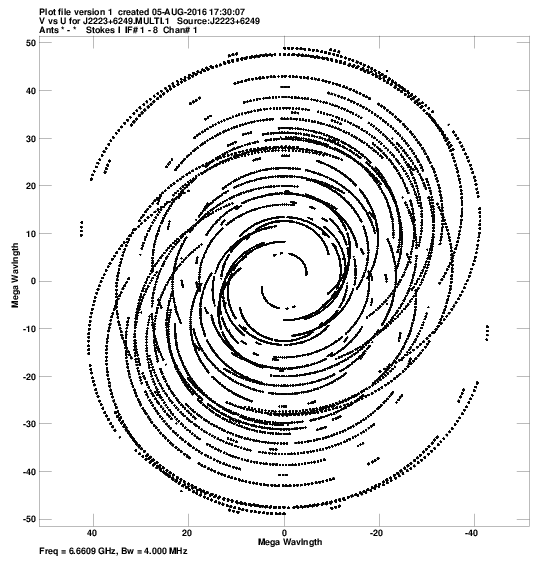
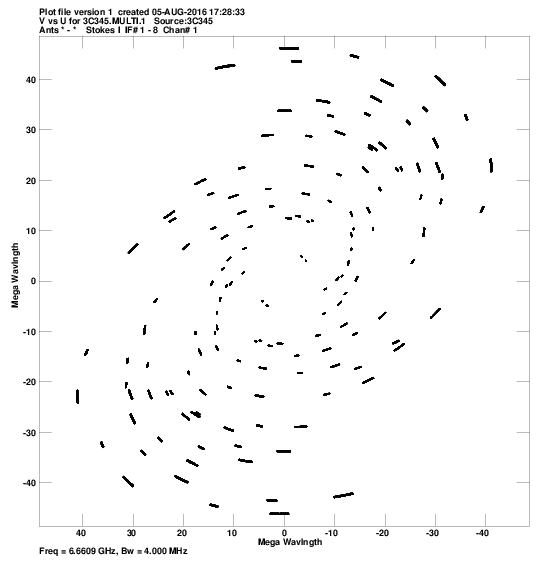
u,v coverage for:
G107.29:
pdf
, or
png
.
3C454.3:
pdf
, or
png
.
J2223+6249:
pdf
, or
png
.
3C345:
pdf
, or
png
.
Comments.
For each source, a plot of the u-v coverage.
Crude maps of sources:
G107.29:
pdf
, or
FITS
.
3C454.3:
pdf
, or
FITS
.
J2223+6249:
pdf
, or
FITS
.
3C345:
pdf
, or
FITS
.
Comments.
For each source, a CLEAN map resulting from the automated fringing and self-cal iterations (or phase-referencing) in the pipeline script.