
EVN User Experiment Pipeline Feedback
Last updated: Fri Mar 31 13:33:17 CEST 2017
blanchard@jive.eu
General Comments.
(
Brief data summary
and
scan listing
)
EY025 observed on 22 Oct 2016. Data rate was 2024 Mbps (16 X 32 MHz subbands, dual polarization, two-bit sampling).
15 Stations were scheduled
However no fringes to Ur due to broken receiver. No clear fringes to Km
The EVN reliability indicator (ERI) for this experiment was
ERI = . ERI* = .
(Ur=0, Km=0, Jb=0.9, Nt=0.4)
Ur broken receiver, Km bad maser, Jb drops out at end, Nt drops out in middle.
Plots of the autocorrelations
Comments.
Each scan plotted separately, all stations.
Plots of the uncalibrated amplitude and phase
against time
Comments.
Full-experiment for Ef-* baselines, no calibration applied. A 1.5 minute plot-averaging was used.
Plots of the uncalibrated amplitude and phase
against frequency channel
Comments.
Scalar averaged Ef-* baselines, each scan plotted separately. No calibration applied yet.
The uncalibrated amplitude and phase of the crosshand
correlations against frequency channel
Comments.
TSYS against time
Comments.
TY1 table, each IF/pol on a separate plot.
Telescope sensitivities
from the a priori TSYS and Gain
curves (the square of this number gives the antenna noise (SEFD) in Jy - the
smaller the better).
Comments.
Gain amplitude from CL2 table.
Fringe-fit phase solutions
(including Parallactic
Angle correction).
Comments.
CL3 station phase solutions -- CL3 = CL2+SN2, thus also includes the initial amplitude/parallactic angle calibration from CL2 and the fringe solutions from SN2.
Fringe-fit delay solutions
Comments.
SN2 station delay solutions for the fringed sources, each IF/pol on a separate plot.
Fringe-fit rate solutions
Comments.
SN2 station rate solutions.
Telescope bandpasses
Comments.
Bandpass table 1. Calibrators used were 3C84 and DA193
Calibrated amplitude and phase against time
(a
priori amplitude calibration and fringe-fit solutions applied).
Comments.
Full-experiment for Ef-* baselines, calibrated with CL3. The 1.5-min plot-averaging still applied.
Calibrated amplitude and phase against frequency
channel
Comments.
Ef-* baselines calibrated with CL3 and BP1. The amp and phase plots self-scale, not necessarily going down to 0 in the case of the amps.
Naturally weighted dirty map (not useful for bright sources)
produced before self-cal of:
0402+379: pdf (not available)
, or
FITS (not available)
.
DA193: pdf (not available)
, or
FITS (not available)
.
3C138: pdf (not available)
, or
FITS (not available)
.
3C84: pdf (not available)
, or
FITS (not available)
.
Comments.
Uniformly weighted dirty map (not useful for bright sources)
produced before self-cal of:
0402+379: pdf (not available)
, or
FITS (not available)
.
DA193: pdf (not available)
, or
FITS (not available)
.
3C138: pdf (not available)
, or
FITS (not available)
.
3C84: pdf (not available)
, or
FITS (not available)
.
Comments.
Phase corrections applied to a priori calibrated and
fringe-fitted data by self-calibration.
0402+379
.
DA193
.
3C138
.
3C84
.
Comments.
Plots of post-SPLIT tables SN1 for the sources that have been individually fringed.
Amplitude corrections applied to a priori calibrated and
fringe-fitted data by self-calibration.
0402+379:
pdf
, or
text file
, or
statistical summary
.
DA193:
pdf
, or
text file
, or
statistical summary
.
3C138:
pdf
, or
text file
, or
statistical summary
.
3C84:
pdf
, or
text file
, or
statistical summary
.
Comments.
As above, but for the post-SPLIT table SN2.
Telescope sensitivities
(the total AMP gain applied
during both a priori and self calibration; the square of this number gives the
antenna noise (SEFD) in Jy).
Comments.
CL4 gain-amp.
Residual closure phase (visibility closure phase with model closure phase subtracted) for:
0402+379
.
DA193
.
3C138
.
3C84
.
Comments.
Separate files per (fringed) source, showing closure phase plots for all the triangles. Only stokes=I shown.
Calibrated visibilities and the source model of:
0402+379
.
DA193
.
3C138
.
3C84
.
Comments.
For each (fringed) source, plots of amp/phase on Ef-* baselines, calibrated with (post-SPLIT) table CL3, with a model-line overplotted.
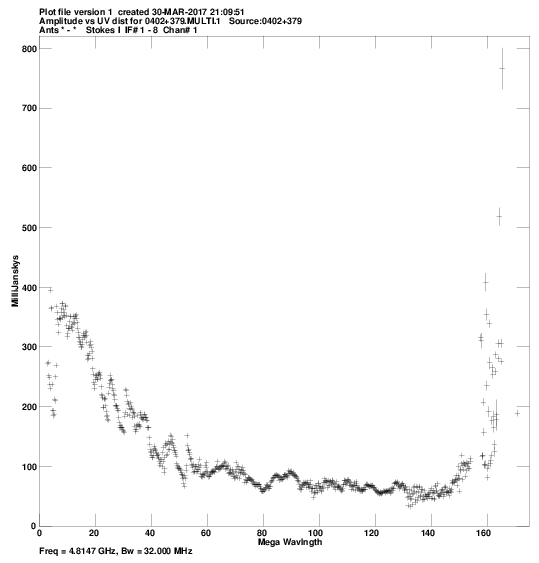
Calibrated visibilities against u,v distance for:
0402+379:
pdf
, or
png
.
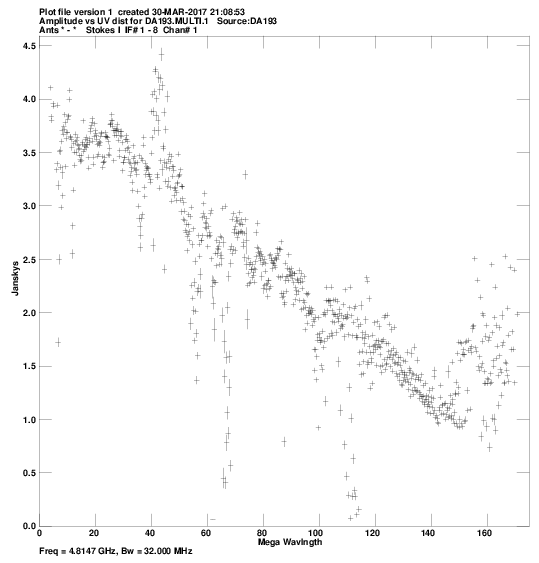
DA193:
pdf
, or
png
.
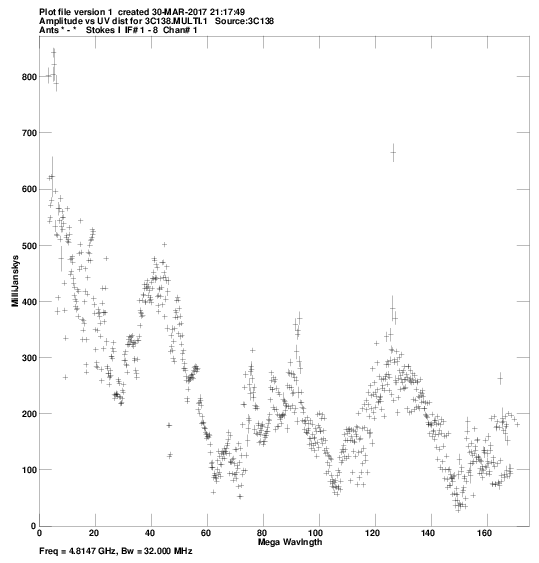
3C138:
pdf
, or
png
.
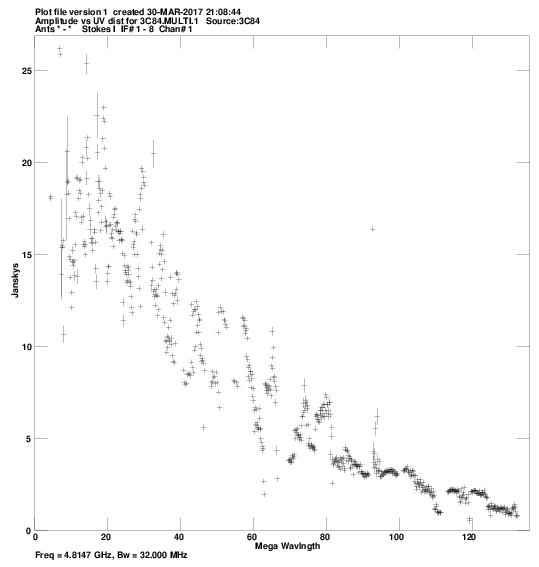
3C84:
pdf
, or
png
.
Comments.
For each source, a plot of amp vs. |uv| distance.
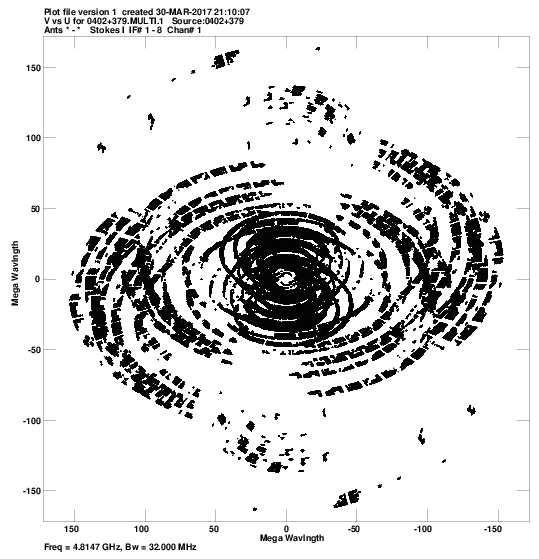
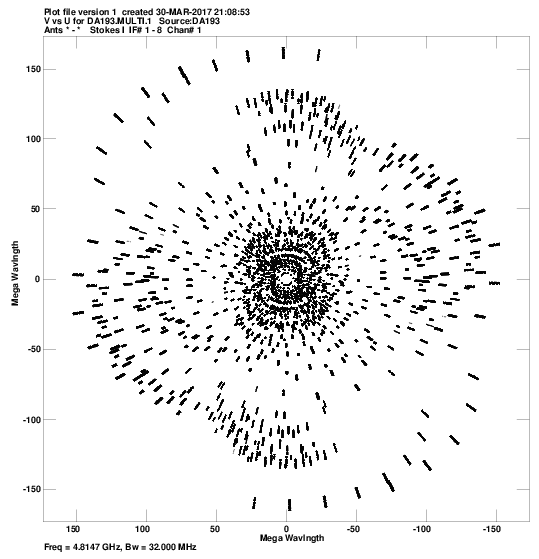
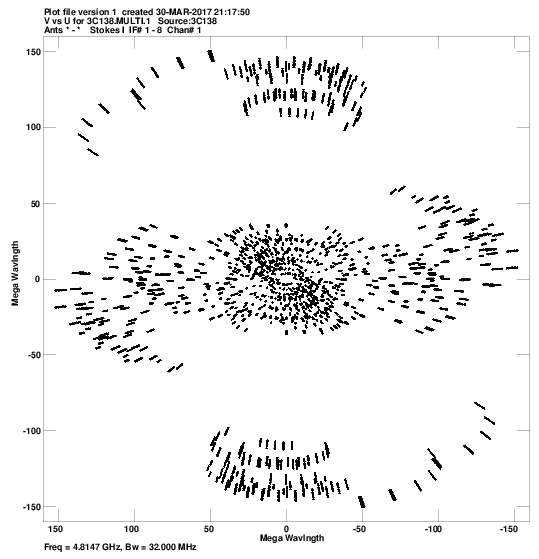
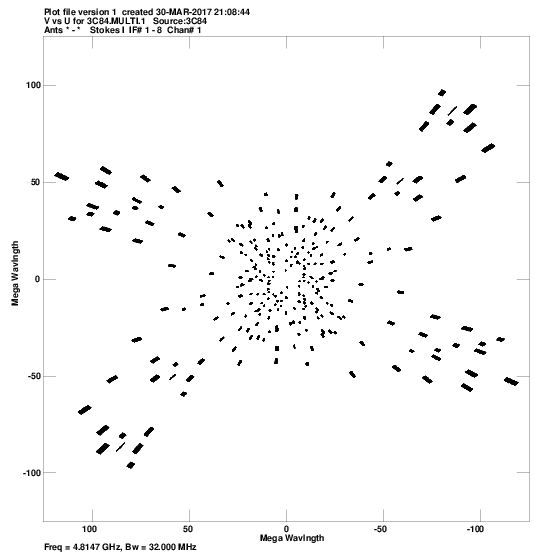
u,v coverage for:
0402+379:
pdf
, or
png
.
DA193:
pdf
, or
png
.
3C138:
pdf
, or
png
.
3C84:
pdf
, or
png
.
Comments.
For each source, a plot of the u-v coverage.
Crude maps of sources:
0402+379:
pdf
, or
FITS
.
DA193:
pdf
, or
FITS
.
3C138:
pdf
, or
FITS
.
3C84:
pdf
, or
FITS
.
Comments.
For each source, a CLEAN map resulting from the automated fringing and self-cal iterations in the pipeline script.