
EVN User Experiment Pipeline Feedback
Last updated: Fri Apr 3 09:00:35 CEST 2015
campbell@jive.nl
General Comments.
(
Brief data summary
and
scan listing
)
GJ014 had 20 good stations, 8 16MHz IFs, 4 polarizations, 32 frequency points per IF/pol, and 2s integrations. Considerably more information is included in the experiment's cover letter on the standard-plots portion of the EVN Archive. In the pipelining, the target sources were treated as phase-reference targets and were not separately fringe-fit. The SOLINT was set to 2.5 minutes. Ef, then Ys (for EVN-only times when Ef was out), and then Nl (for VLBA-only times) were used as the reference stations.
The EVN reliability indicator (ERI) for this experiment was
ERI = 0.726 . ERI* = 0.915 .
The losses include Sv having no signal in the RCP channels, Jb missing the whole experiment because of winds, and Ef missing 2.5hr also because of winds. The wind-related outages count against ERI but not ERI*. The ERI values pertain to only the EVN stations in the experiment.
Plots of the autocorrelations
Comments.
Each scan plotted separately, all stations.
plots of the uncalibrated amplitude and phase
against time
Comments.
Full-experiment for Ef-* and Nl-* baselines, no calibration applied. A 2.5-minute plot-averaging was used.
Plots of the uncalibrated amplitude and phase
against frequency channel
Comments.
Scalar averaged Ef-* and Nl-* baselines, each scan plotted separately. No calibration applied yet.
The uncalibrated amplitude and phase of the crosshand
correlations against frequency channel
Comments.
Scalar averaged Ef-* and Nl-* baselines showing LR, each scan plotted separately. No calibration applied yet.
TSYS against time
Comments.
TY1 table, each IF/pol on a separate plot.
Telescope sensitivities
from the a priori TSYS and Gain
curves (the square of this number gives the antenna noise (SEFD) in Jy - the
smaller the better).
Comments.
Gain amplitude from CL2 table.
Fringe-fit phase solutions
(including Parallactic
Angle correction).
Comments.
CL3 station phase solutions -- CL3 = CL2+SN2, thus also includes the initial amplitude/parallactic angle calibration from CL2 and the fringe solutions from SN2.
Fringe-fit delay solutions
Comments.
SN2 station delay solutions for the fringed sources, each IF/pol on a separate plot. Most of On data is gone after fringe-fitting. Only a few individual outliers (e.g., Hh IF6/R last solint).
Fringe-fit rate solutions
Comments.
SN2 station rate solutions. Stations involved in longer baselines show evolution of rate with time (likely arising from the double nature of the target) -- by the time Nl becomes the reference it's rate is around -15 mHz.
Telescope bandpasses
Comments.
Bandpass table 1. 3C345 was used for bandpass calibration.
Calibrated amplitude and phase against time
(a
priori amplitude calibration and fringe-fit solutions applied).
Comments.
Full-experiment for Ef-* and Nl-* baselines, calibrated with CL3. The 2.5-minute plot-averaging still applied.
Calibrated amplitude and phase against frequency
channel
Comments.
Ef-* and Nl-* baselines calibrated with CL3 and BP1. The amp and phase plots self-scale, not necessarily going down to 0 in the case of the amps.
Naturally weighted dirty map (not useful for bright sources)
produced before self-cal of:
3C345: pdf (not available)
, or
FITS (not available)
.
1632-0033: pdf (not available)
, or
FITS (not available)
.
Comments.
Naturally-weighted dirty maps of the phase-referenced-to sources.
Uniformly weighted dirty map (not useful for bright sources)
produced before self-cal of:
3C345: pdf (not available)
, or
FITS (not available)
.
1632-0033: pdf (not available)
, or
FITS (not available)
.
Comments.
Uniformly-weighted dirty maps of the phase-referenced-to sources.
Phase corrections applied to a priori calibrated and
fringe-fitted data by self-calibration.
3C345
.
1632-0033
.
Comments.
Plots of post-SPLIT tables SN1 for the sources that have been individually fringed.
Amplitude corrections applied to a priori calibrated and
fringe-fitted data by self-calibration.
3C345:
pdf
, or
text file
, or
statistical summary
.
1632-0033:
pdf
, or
text file
, or
statistical summary
.
Comments.
As above, but for the post-SPLIT table SN2.
Telescope sensitivities
(the total AMP gain applied
during both a priori and self calibration; the square of this number gives the
antenna noise (SEFD) in Jy).
Comments.
CL4 gain-amp.
Residual closure phase (visibility closure phase with model closure phase subtracted) for:
3C345
.
1632-0033
.
Comments.
Separate files per (fringed) source, showing closure phase plots for all the triangles. Only stokes=I shown.
Calibrated visibilities and the source model of:
3C345
.
1632-0033
.
Comments.
For each (fringed) source, plots of amp/phase on Ef-* and Nl-* baselines, calibrated with (post-SPLIT) table CL3, with a model-line overplotted.
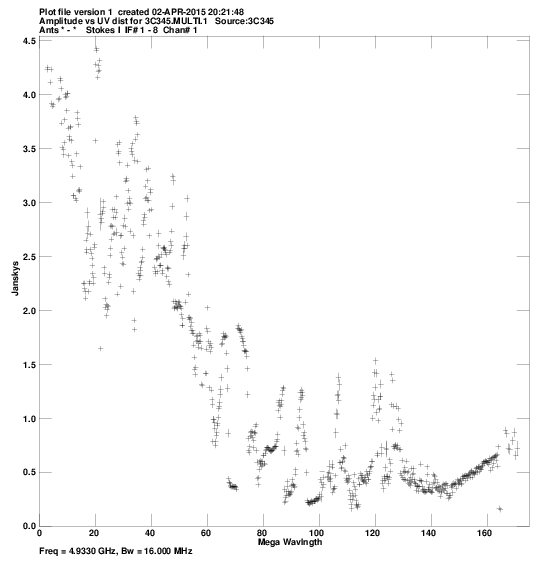
Calibrated visibilities against u,v distance for:
3C345:
pdf
, or
png
.
1632-0033:
pdf
, or
png
.
Comments.
For each source, a plot of amp vs. |uv| distance. The target has apparently excess flux density for |uv| longer than about 170 Mlambda (i.e., above the longest |uv| for 3C345). These issues can probably be improved with more careful calibration (no interactive SNSMO, SNEDT in the pipeline).
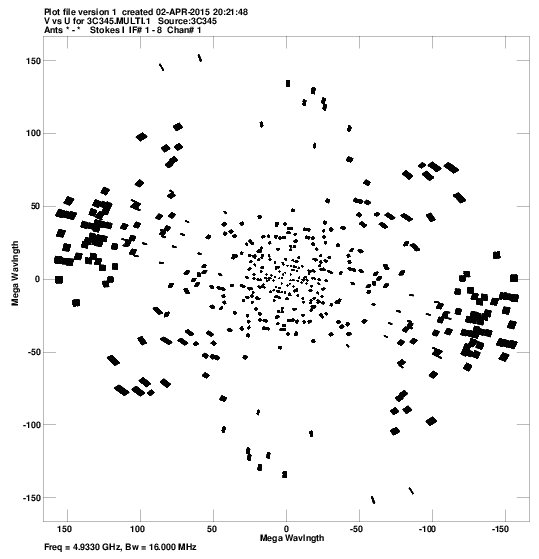
u,v coverage for:
3C345:
pdf
, or
png
.
1632-0033:
pdf
, or
png
.
Comments.
For each source, a plot of the u-v coverage.
Crude maps of sources:
3C345:
pdf
, or
FITS
.
1632-0033:
pdf
, or
FITS
.
Comments.
For each source, a CLEAN map resulting from the automated fringing and self-cal iterations (or phase-referencing) in the pipeline script.