
EVN User Experiment Pipeline Feedback
Last updated: Thu Apr 9 17:20:53 CEST 2015
campbell@jive.nl
General Comments.
(
Brief data summary
and
scan listing
)
GP052D had 12 good stations, 4 16MHz IFs, 4 polarizations, 4s integrations. This pipelining corresponds to the interpulse pass,, which had 4096 frequency points per IF/pol. Considerably more information is included in the experiment's cover letter on the standard-plots portion of the EVN Archive. In the pipelining, the SOLINT for FRING was set to 1.0 minutes. Ar was used as the reference station.
The EVN reliability indicator (ERI) for this experiment was
ERI = 1.000 . ERI* = 1.000 .
The ERI values pertain only to the EVN stations in the experiment (thus the loss of Br incurs no penalty). No penalty for loss of frequency range outside the nominal front-end range.
Plots of the autocorrelations
Comments.
Each scan plotted separately, all stations.
plots of the uncalibrated amplitude and phase
against time
Comments.
Full-experiment for Ar-* baselines, no calibration applied. A 1-minute plot-averaging was used.
Plots of the uncalibrated amplitude and phase
against frequency channel
Comments.
Scalar averaged Ar-* baselines, each scan plotted separately. No calibration applied yet.
The uncalibrated amplitude and phase of the crosshand
correlations against frequency channel
Comments.
Scalar averaged Ar-* baselines showing LR, each scan plotted separately. No calibration applied yet.
TSYS against time
Comments.
TY1 table, each IF/pol on a separate plot. The amplitude-calibration information in the Jb log was unreliable, so we assumed a flat gain curve (a reasonable assumption) and a combination of unity Tsys and DFPU = reciprocal nominal-SEFD.
Telescope sensitivities
from the a priori TSYS and Gain
curves (the square of this number gives the antenna noise (SEFD) in Jy - the
smaller the better).
Comments.
Gain amplitude from CL2 table.
Fringe-fit phase solutions
(including Parallactic
Angle correction).
Comments.
CL3 station phase solutions -- CL3 = CL2+SN2, thus also includes the initial amplitude/parallactic angle calibration from CL2 and the fringe solutions from SN2.
Fringe-fit delay solutions
Comments.
SN2 station delay solutions for the fringed sources, each IF/pol on a separate plot. It's not clear how significant the fringe-fit solutions are. Only the two shortest baselines didn't resolve (out) the fringe-finders, and the pulsars may have had dynamic spectra that would not be well served by the single delay (slope phas/freq) and rate (slope phas/time) parameters per SOLINT that FRING fits for.
Fringe-fit rate solutions
Comments.
SN2 station rate solutions.
Telescope bandpasses
Comments.
Bandpass table 1. J1932+1059 was used for bandpass calibration -- but referring to the "cross" standard plots of amp(freq) shows that there is a lot of structure in the bandpass (at least on Ar-*) that may not be desirable to be calibrated out.
Calibrated amplitude and phase against time
(a
priori amplitude calibration and fringe-fit solutions applied).
Comments.
Full-experiment for Ar-* baselines, calibrated with CL3. The 1-minute plot-averaging still applied.
Calibrated amplitude and phase against frequency
channel
Comments.
Ar-* baselines calibrated with CL3 and BP1. The amp and phase plots self-scale, not necessarily going down to 0 in the case of the amps.
Naturally weighted dirty map (not useful for bright sources)
produced before self-cal of:
B1957+20: pdf (not available)
, or
FITS (not available)
.
J1932+1059: pdf (not available)
, or
FITS (not available)
.
Comments.
Naturally-weighted dirty maps of the phase-referenced-to sources. (none here, every source was fringed)
Uniformly weighted dirty map (not useful for bright sources)
produced before self-cal of:
B1957+20: pdf (not available)
, or
FITS (not available)
.
J1932+1059: pdf (not available)
, or
FITS (not available)
.
Comments.
Uniformly-weighted dirty maps of the phase-referenced-to sources. (none here, every source was fringed)
Phase corrections applied to a priori calibrated and
fringe-fitted data by self-calibration.
B1957+20
.
J1932+1059
.
Comments.
Plots of post-SPLIT tables SN1 for the sources that have been individually fringed.
Amplitude corrections applied to a priori calibrated and
fringe-fitted data by self-calibration.
B1957+20:
pdf
, or
text file
, or
statistical summary
.
J1932+1059:
pdf
, or
text file
, or
statistical summary
.
Comments.
As above, but for the post-SPLIT table SN2.
Telescope sensitivities
(the total AMP gain applied
during both a priori and self calibration; the square of this number gives the
antenna noise (SEFD) in Jy).
Comments.
CL4 gain-amp.
Residual closure phase (visibility closure phase with model closure phase subtracted) for:
B1957+20
.
J1932+1059
.
Comments.
Separate files per (fringed) source, showing closure phase plots for all the triangles. Only stokes=I shown.
Calibrated visibilities and the source model of:
B1957+20
.
J1932+1059
.
Comments.
For each (fringed) source, plots of amp/phase on Ar-* baselines, calibrated with (post-SPLIT) table CL3, with a model-line overplotted.
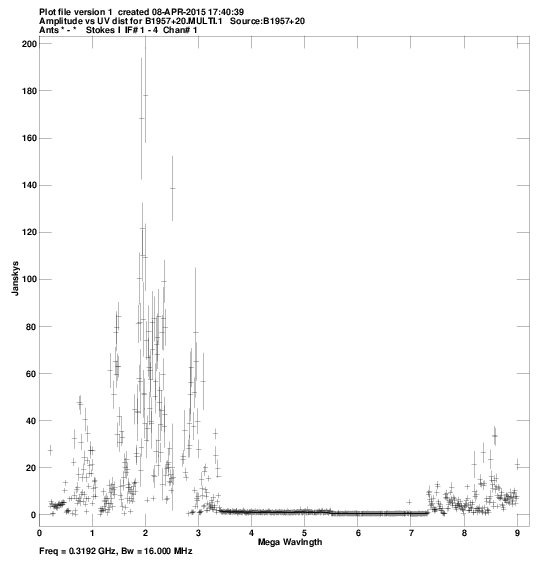
Calibrated visibilities against u,v distance for:
B1957+20:
pdf
, or
png
.
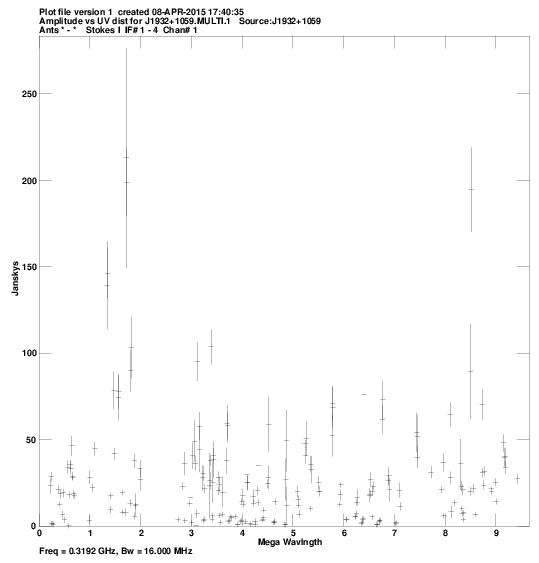
J1932+1059:
pdf
, or
png
.
Comments.
For each source, a plot of amp vs. |uv| distance.
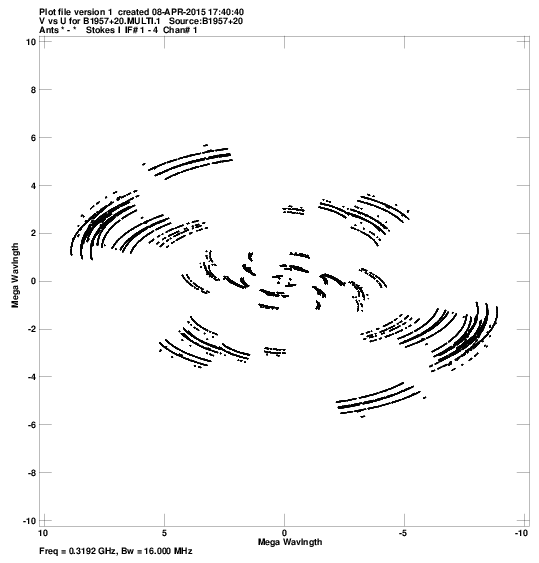
u,v coverage for:
B1957+20:
pdf
, or
png
.
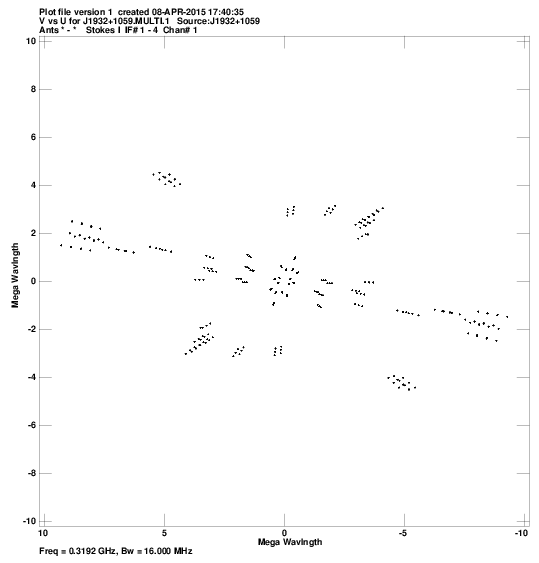
J1932+1059:
pdf
, or
png
.
Comments.
For each source, a plot of the u-v coverage.
Crude maps of sources:
B1957+20:
pdf
, or
FITS
.
J1932+1059:
pdf
, or
FITS
.
Comments.
For each source, a CLEAN map resulting from the automated fringing and self-cal iterations (or phase-referencing) in the pipeline script.