
EVN User Experiment Pipeline Feedback
Last updated: Thu Dec 24 13:06:59 CET 2015
campbell@jive.eu
General Comments.
(
Brief data summary
and
scan listing
)
GP053E had 12 stations, 8 16MHz IFs, 4 polarizations, 32 frequency points per IF/pol, and 2s integrations. Considerably more information is included in the experiment's cover letter on the standard-plots portion of the EVN Archive. This pipelining corresponds to the multiple phase-center output target ARP299A. In the pipelining, the target sources were treated as phase-reference targets and were not separately fringe-fit. The SOLINT was set automatically to a value commensurate with a typical reference-source scan. Ef, then Ys were used as the reference stations.
The EVN reliability indicator (ERI) for this experiment was
ERI = 0.805 . ERI* = 0.805 .
The losses include Mc having an unstable IF1, Tr very low IF2/LCP, and also Zc having much lower response than expected (although it was not explicitly flagged out here in the pipeline).
Plots of the autocorrelations
Comments.
Each scan plotted separately, all stations.
plots of the uncalibrated amplitude and phase
against time
Comments.
Full-experiment for Ef-* baselines, no calibration applied. A 2-minute plot-averaging was used.
Plots of the uncalibrated amplitude and phase
against frequency channel
Comments.
Scalar averaged Ef-* baselines, each scan plotted separately. No calibration applied yet.
The uncalibrated amplitude and phase of the crosshand
correlations against frequency channel
Comments.
Scalar averaged Ef-* baselines showing LR, each scan plotted separately. No calibration applied yet.
TSYS against time
Comments.
TY1 table, each IF/pol on a separate plot. Jb and the KVAZARs remain with their 'dummy' unity Tsys & DPFU set to the reciprocal nominal-SEFD. For Zc, this DPFU was re-set to a value more consistent with the amplitudes coming out of the correlator (SEFD from 400 to ~7700).
Telescope sensitivities
from the a priori TSYS and Gain
curves (the square of this number gives the antenna noise (SEFD) in Jy - the
smaller the better).
Comments.
Gain amplitude from CL2 table.
Fringe-fit phase solutions
(including Parallactic
Angle correction).
Comments.
CL3 station phase solutions -- CL3 = CL2+SN2, thus also includes the initial amplitude/parallactic angle calibration from CL2 and the fringe solutions from SN2. Tr shows more questionable phase-connection choices stemming from likely spurious rate solutions.
Fringe-fit delay solutions
Comments.
SN2 station delay solutions for the fringed sources, each IF/pol on a separate plot. A copule outliers in some IF/pol for Ys early.
Fringe-fit rate solutions
Comments.
SN2 station rate solutions. A couple outliers in some IF/pol for Tr.
Telescope bandpasses
Comments.
Bandpass table 1. 1150+812 was used for bandpass calibration.
Calibrated amplitude and phase against time
(a
priori amplitude calibration and fringe-fit solutions applied).
Comments.
Full-experiment for Ef-* baselines, calibrated with CL3. The 2-min plot-averaging still applied.
Calibrated amplitude and phase against frequency
channel
Comments.
Ef-* baselines calibrated with CL3 and BP1. The amp and phase plots self-scale, not necessarily going down to 0 in the case of the amps.
Naturally weighted dirty map (not useful for bright sources)
produced before self-cal of:
1150+812: pdf (not available)
, or
FITS (not available)
.
J1128+5925: pdf (not available)
, or
FITS (not available)
.
ARP299A:
pdf
, or
FITS
.
Comments.
Naturally-weighted dirty maps of the phase-referenced-to sources.
Uniformly weighted dirty map (not useful for bright sources)
produced before self-cal of:
1150+812: pdf (not available)
, or
FITS (not available)
.
J1128+5925: pdf (not available)
, or
FITS (not available)
.
ARP299A:
pdf
, or
FITS
.
Comments.
Uniformly-weighted dirty maps of the phase-referenced-to sources.
Phase corrections applied to a priori calibrated and
fringe-fitted data by self-calibration.
1150+812
.
J1128+5925
.
ARP299A (not available)
.
Comments.
Plots of post-SPLIT tables SN1 for the sources that have been individually fringed.
Amplitude corrections applied to a priori calibrated and
fringe-fitted data by self-calibration. (not available: no amp self-cal
iterations; see comments for the next plot)
1150+812: pdf (not available)
, or
text file (not available)
, or
statistical summary (not available)
.
J1128+5925: pdf (not available)
, or
text file (not available)
, or
statistical summary (not available)
.
ARP299A: pdf (not available)
, or
text file (not available)
, or
statistical summary (not available)
.
Comments.
As above, but for the post-SPLIT table SN2.
Telescope sensitivities (not available)
(the total AMP gain applied
during both a priori and self calibration; the square of this number gives the
antenna noise (SEFD) in Jy).
Comments.
CL4 gain-amp. This plot was not made because the self-cal was limited to a single phase-only iteration (this plot requires amp self-cal). The self-cal was truncated before the first amp+phase iteration, because that seemed to lock in spurious large amp peaks in Ef-Tr & Ef-Ys and corrugations in other baselines (appears to be fitting to side-lobes). Removing Jb && Zc seems to get rid of these, but that seemed to be a draconian solution for the pipeline to take. The phase-only self-cal iteration did improve Tr's phase(t) as seen in the VPLOT_MODEL plots
Residual closure phase (visibility closure phase with model closure phase subtracted) for:
1150+812
.
J1128+5925
.
ARP299A (not available)
.
Comments.
Separate files per (fringed) source, showing closure phase plots for all the triangles. Only stokes=I shown.
Calibrated visibilities and the source model of:
1150+812
.
J1128+5925
.
ARP299A (not available)
.
Comments.
For each (fringed) source, plots of amp/phase on Ef-* baselines, calibrated with (post-SPLIT) table CL3, with a model-line overplotted. Zc's marginal consistency in amp(t) using only the DPFU in the ANTAB file to align the low raw correlation coefficients with the calibrated amps.
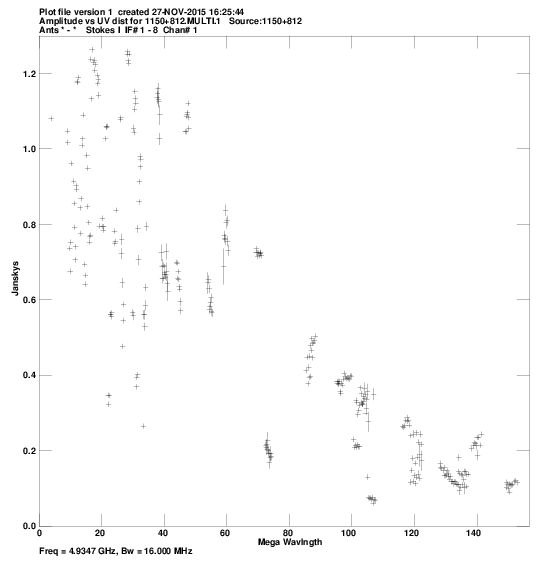
Calibrated visibilities against u,v distance for:
1150+812:
pdf
, or
png
.
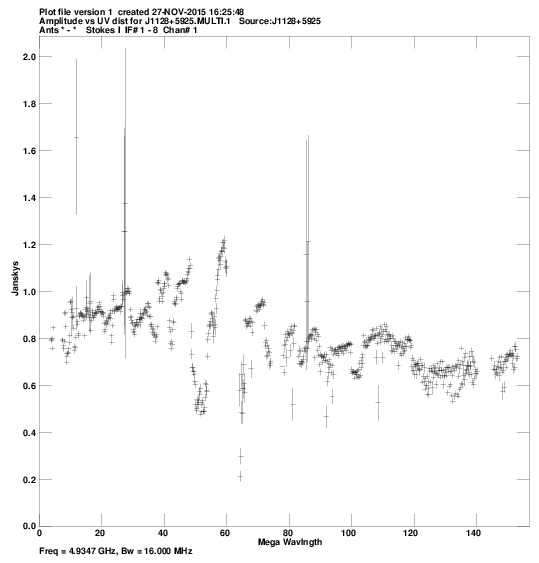
J1128+5925:
pdf
, or
png
.
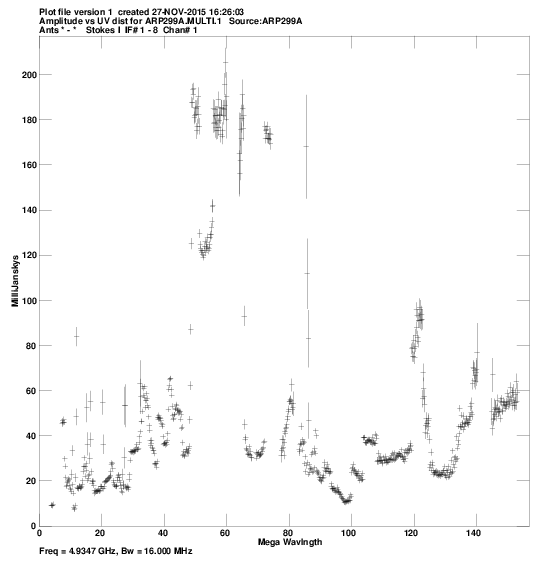
ARP299A:
pdf
, or
png
.
Comments.
For each source, a plot of amp vs. |uv| distance. Short-baseline scatter that can probably be improved with more careful calibration. The "V"-shape around 50-60 M-lambda is mostly Zc-*.
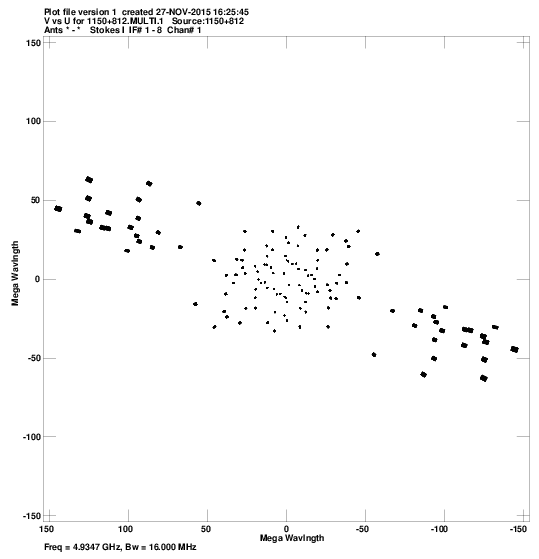
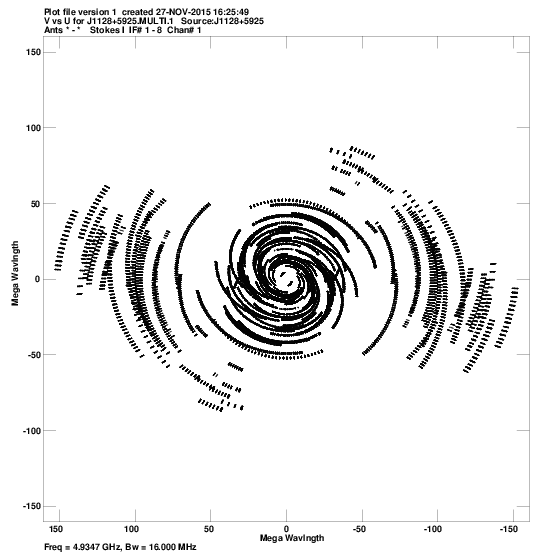
u,v coverage for:
1150+812:
pdf
, or
png
.
J1128+5925:
pdf
, or
png
.
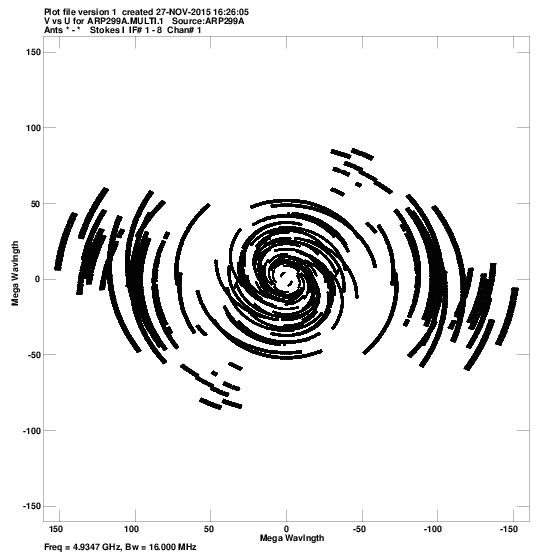
ARP299A:
pdf
, or
png
.
Comments.
For each source, a plot of the u-v coverage.
Crude maps of sources:
1150+812:
pdf
, or
FITS
.
J1128+5925:
pdf
, or
FITS
.
ARP299A:
pdf
, or
FITS
.
Comments.
For each source, a CLEAN map resulting from the automated fringing and self-cal iterations (or phase-referencing) in the pipeline script. The peak brightnesses found in the images seem to be higher than they have been in past GP053/EP087 C-band epochs, in a way that is not reflected in the raw correlator-coefficient amplitude, nor was seen in other session 1/15 experiments that had other epochs allowing a similar comparison. The amp ratios between the targets and J1128 do trace a more consistent history.