
EVN User Experiment Pipeline Feedback
Last updated: Mon Apr 12 11:02:24 CEST 2004
campbell@jive.nl
General Comments.
(
Brief data summary
and
scan listing
)
This experiment comprised 17 stations (VLBA+GbYyEbNtMcWbAr) with 4 8MHz IFs at X-band, each with 4 polarizations and 32 frequency points per IF/pol. Integration times were 2s. Some stations started or ended the experiment with the sources outside of telescope pointing limits. Considerably more information is included in the experiment's cover letter on the standard-plots portion of the archive.
The EVN reliability indicator was ERI=0.93. ERI estimates the ratio of good -to- expected visibilities. This was calculated by considering periods of individual telescopes being out-of-limits and Noto's recording RCP onto both polarizations at X-band to be "expected" losses. The principal losses reducing the "good" visibilities included: Ar no fringes in IF3/RR and IF4/both, Wb large internal RFI in IF3 that apparently has affected fringes, and 0-weight in Ov IF4/LCP in later passes. ERI*, the same parameter but not including things beyond the telescope's control (weather, etc.) was the same.
Plots of the autocorrelations
.
Comments.
60p of plots, J1051 in ~20min chunks. Internal RFI in Yy IF1/RCP and Wb IF3/LCP (spill-over into R?). see cover letter for more details.
Plots of the uncalibrated amplitude and phase against time
.
Comments.
32p of plots, full-experiment Gb-* baselines, no calibration applied.
Plots of the uncalibrated amplitude and phase against frequency
channel
.
Comments.
426p(!) of plots, each scan of DA193, J1051, and J1048 for Gb-* baselines, both parallel-hand polarizations.
The uncalibrated amplitude and phase of the crosshand
correlations against frequency channel
.
Comments.
224p(!) of plots, each scan of DA193, J1051, and J1048 for Gb-* baselines, only LR.
TSYS against time
.
Comments.
13p of plots, showing TY1 table. spike in Eb ~1145.
Telescope sensitivities
from the a priori TSYS and Gain curves (the square of this
number gives the antenna noise (SEFD) in Jy - the smaller the better).
Comments.
13p of plots, showing CL2 table (same Eb spike). From here one, no more plots for Yy RCP (because of internal RFI in IF1/RCP affecting solutions?). See standard plots (and old-style plots) for documentation of apparently perfectly good Yy-* RCP fringes throughout the experiment.
Fringe-fit phase solutions
(including Parallactic Angle correction).
Comments.
12p of plots, showing CL station phase solutions.
Fringe-fit delay solutions
.
Comments.
12p of plots, showing SN2 station delay solutions.
Fringe-fit rate solutions
.
Comments.
12p of plots, showing SN2 station rate solutions (some obvious outliers that could affect automatic AIPS-determined phase-connection decisions).
Telescope bandpasses
.
Comments.
4p of plots, showing bandpass table 1.
Calibrated amplitude and phase against time
(a priori amplitude calibration and fringe-fit solutions applied).
Comments.
32p of plots, showing Gb-* baselines calibrated with table CL3.
Calibrated amplitude and phase against frequency channel
.
Comments.
377p(!) of plots, showing Gb-* baselines calibrated with CL3 and BP1. Ringing in passbands for DA193's scan (but not y-axis scale quite small indeed).
Naturally weighted dirty map produced before self-cal of:
J1051+2119
.
DA193
.
J1048+2115
.
Comments.
Natural-weighted (dirty) maps for the calibrators DA193 (1 scan only), J1501, and J1048 (1 scan per pass only).
Uniformly weighted dirty map produced before self-cal of:
J1051+2119
.
DA193
.
J1048+2115
.
Comments.
Uniform-weighted (dirty) maps of the above calibrators.
Phase corrections applied to a priori calibrated and fringe-fitted data by self-calibration.
J1051+2119.
DA193.
J1048+2115.
Comments.
For each of the calibrators (DA193, J1051, J1048), 11-12p of plots of post-SPLIT table SN1. (DA193 had only 1 scan, hence only 2 points in its plots.)
Amplitude corrections applied to a priori calibrated and fringe-fitted data by self-calibration.
J1051+2119:
postscript
, or
text file
.
DA193:
postscript
, or
text file
.
J1048+2115:
postscript
, or
text file
.
Comments.
As above, but for the post-SPLIT table SN2
Telescope sensitivities
(the total AMP gain applied during
both a priori and self calibration; the square of this number gives the antenna
noise (SEFD) in Jy).
Comments.
12p of plots, showing CL4 gain-amp.
Residual closure phase (visibility closure phase with model closure phase subtracted) for:
J1051+2119
.
DA193
.
J1048+2115
.
Comments.
For each of the calibrators (DA193, J1051, J1048), &ge 100p of plots showing closure phase for many triangles (not just Gb-*-*).
Calibrated visibilities and the source model of:
J1051+2119
.
DA193
.
J1048+2115
.
Comments.
For each of the calibrators, 26-32p of plots of amp/phase on Gb-* baselines calibrated with (post-SPLIT) table CL3, with a model-line overplotted.
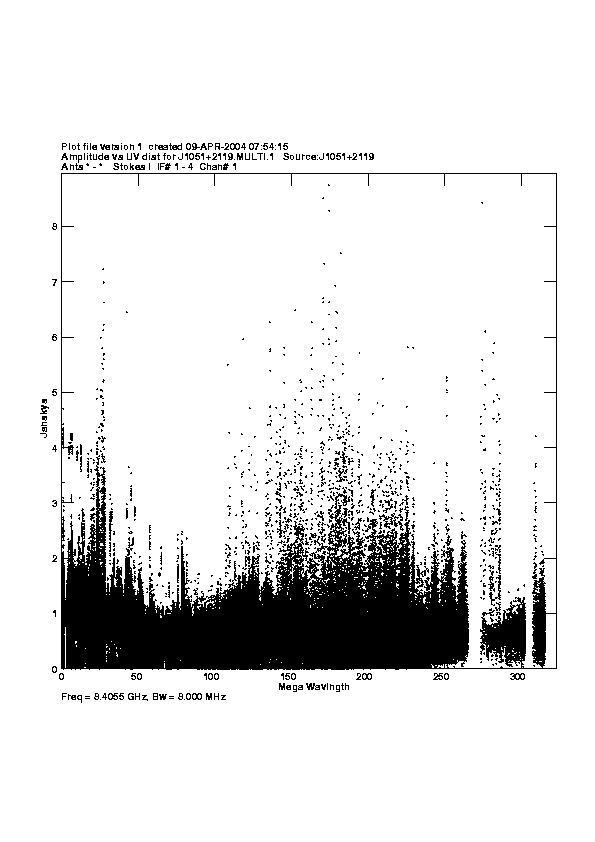
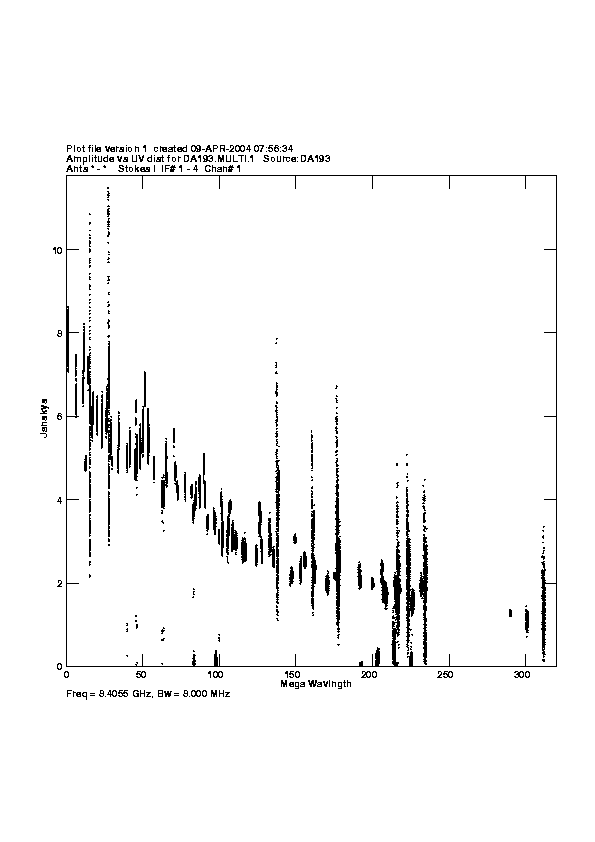
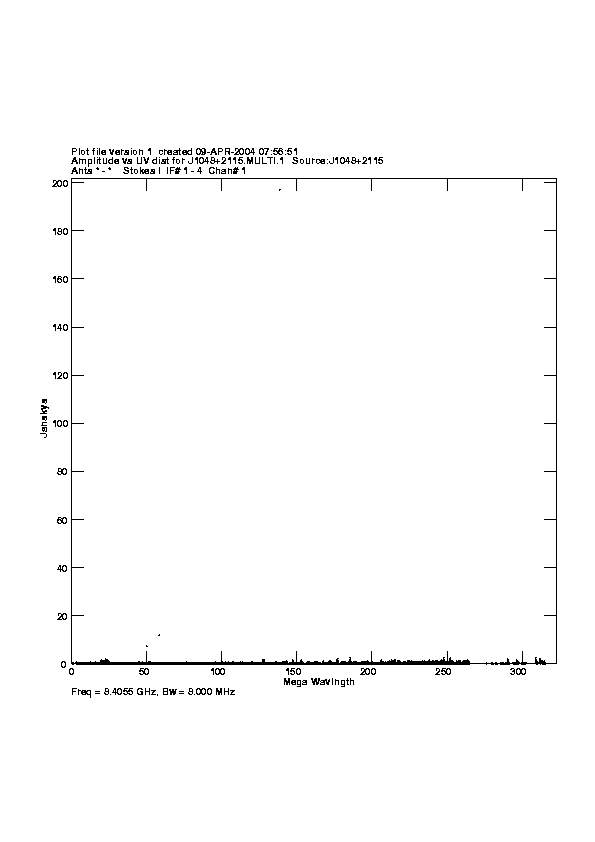
Calibrated visibilities against u,v distance for:
J1051+2119.
postscript
, or
png (smaller)
DA193.
postscript
, or
png (smaller)
J1048+2115.
postscript
, or
png (smaller)
Comments.
For each of the calibrators, a plot of amp vs. |uv| distance. For J1048, there is a ludicrously high outlier.
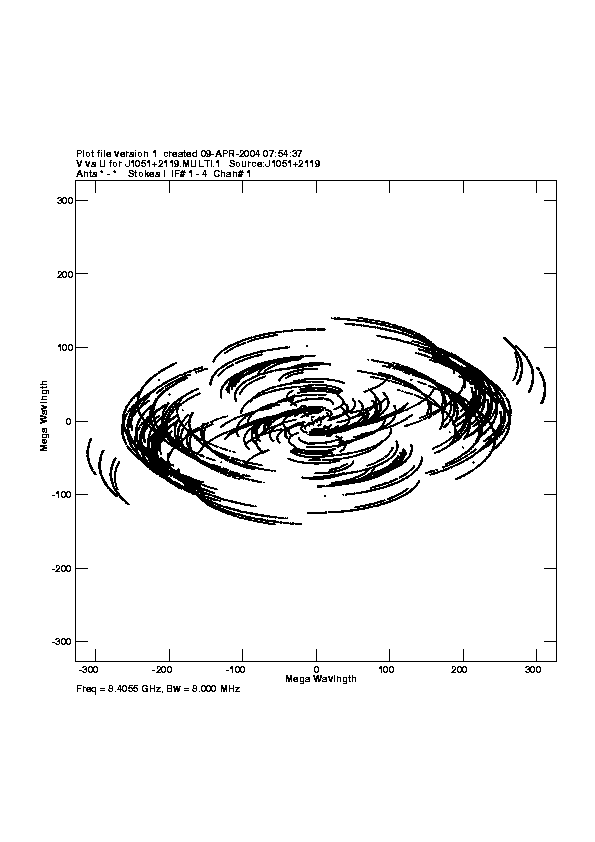
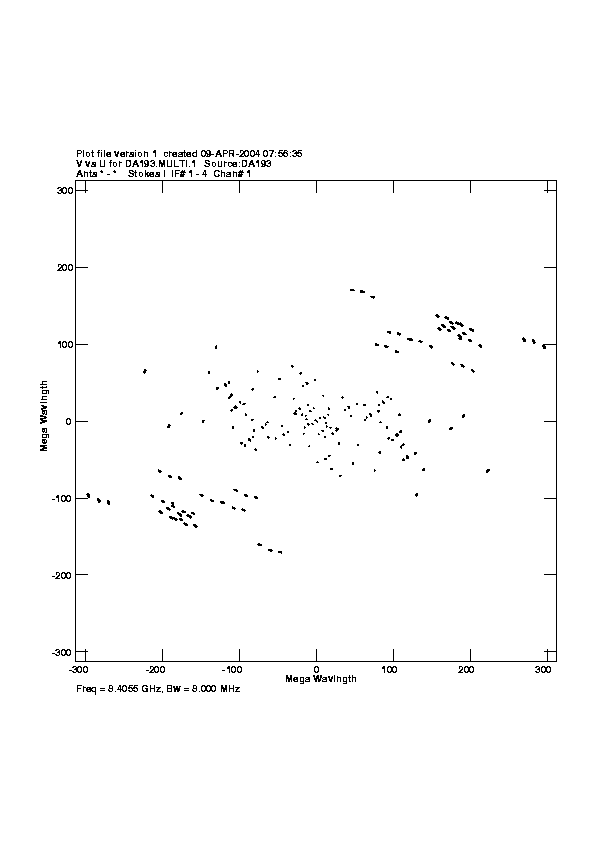
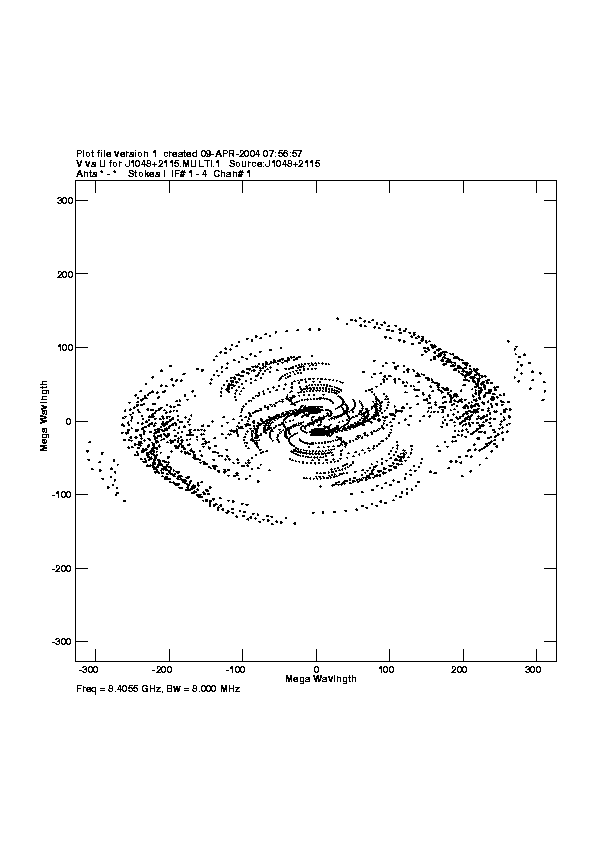
u,v coverage for:
J1051+2119.
postscript
, or
png (smaller)
DA193.
postscript
, or
png (smaller)
J1048+2115.
postscript
, or
png (smaller)
Comments.
For each of the calibrators, a plot of the u-v coverage.
Crude map of J1051+2119 from the pipeline
.
Crude map of DA193 from the pipeline
.
Crude map of J1048+2115 from the pipeline
.
Comments.
For each of the calibrators, a CLEAN map resulting from the automated fringing/calibrating pipeline script.