
EVN User Experiment Pipeline Feedback
Last updated: Thu Feb 12 13:29:40 CET 2009
campbell@jive.nl
General Comments.
(
Brief data summary
and
scan listing
)
GW019A had 21 stations, 8 8 MHz IFs, four polarizations, and used 16 frequency points per IF/pol, with 1s integrations. Considerably more information is included in the experiment's cover letter on the standard-plots portion of the EVN Archive. The SOLINT was 2 minutes. Ef, Tr, Kp, and Ar were used as the reference stations (in that order); Tr for periods when Ef was out in the EVN-only part; then Kp for after the EVN stations left the array, with Ar filling in for periods when Kp was out.
The EVN reliability indicator (ERI) for this experiment was
ERI = 0.987 . ERI* = 0.987 .
The ERI was 0.987, with losses including Nt IF4/LCP. The ERI is computed from only the EVN stations (in GW019A, the problems came mostly with the upper subbands of the VLBAs/Yy -- an overall "RI" would be about 0.736, assuming both the upper two IFs from all VLBAs/Yy were lost, and also including Pt's absence).
Plots of the autocorrelations
Comments.
Each scan plotted separately, all stations.
plots of the uncalibrated amplitude and phase
against time
Comments.
Full-experiment for Ef-* & Kp-* baselines, no calibration applied. A 2 minute plot-averaging was used.
Plots of the uncalibrated amplitude and phase
against frequency channel
Comments.
Scalar averaged Ef-* & Kp-* baselines, each scan plotted separately. No calibration applied yet.
The uncalibrated amplitude and phase of the crosshand
correlations against frequency channel
Comments.
Scalar averaged Ef-* & Kp-* baselines for LR, each scan plotted separately. No calibration applied yet.
TSYS against time
Comments.
TY1 table, each IF/pol on a separate plot.
Telescope sensitivities
from the a priori TSYS and Gain
curves (the square of this number gives the antenna noise (SEFD) in Jy - the
smaller the better).
Comments.
Gain amplitude from CL2 table.
Fringe-fit phase solutions
(including Parallactic
Angle correction).
Comments.
CL3 station phase solutions -- CL3 = CL2+SN2, thus also includes the initial amplitude/parallactic angle calibration from CL2 and the fringe solutions from SN2.
Fringe-fit delay solutions
Comments.
SN2 station delay solutions for the fringed sources, each IF/pol on a separate plot.
Fringe-fit rate solutions
Comments.
SN2 station rate solutions.
Telescope bandpasses
Comments.
Bandpass table 1. DA193 and 0528+134 were used for bandpass calibration.
Calibrated amplitude and phase against time
(a
priori amplitude calibration and fringe-fit solutions applied).
Comments.
Full-experiment for Ef-* & Kp-* baselines, calibrated with CL3. The 2-min plot-averaging still applied.
Calibrated amplitude and phase against frequency
channel
Comments.
Ef-* & Kp-* baselines calibrated with CL3 and BP1. The amp and phase plots self-scale, not necessarily going down to 0 in the case of the amps.
Naturally weighted dirty map (not useful for bright sources)
produced before self-cal of:
MG0414: pdf (not available)
, or
FITS (not available)
.
0528+134: pdf (not available)
, or
FITS (not available)
.
3C84: pdf (not available)
, or
FITS (not available)
.
J0409+1217: pdf (not available)
, or
FITS (not available)
.
J0422+0219: pdf (not available)
, or
FITS (not available)
.
DA193: pdf (not available)
, or
FITS (not available)
.
Comments.
Uniformly weighted dirty map (not useful for bright sources)
produced before self-cal of:
MG0414: pdf (not available)
, or
FITS (not available)
.
0528+134: pdf (not available)
, or
FITS (not available)
.
3C84: pdf (not available)
, or
FITS (not available)
.
J0409+1217: pdf (not available)
, or
FITS (not available)
.
J0422+0219: pdf (not available)
, or
FITS (not available)
.
DA193: pdf (not available)
, or
FITS (not available)
.
Comments.
Phase corrections applied to a priori calibrated and
fringe-fitted data by self-calibration.
MG0414
.
0528+134
.
3C84
.
J0409+1217
.
J0422+0219
.
DA193
.
Comments.
Plots of post-SPLIT tables SN1 for the sources.
Amplitude corrections applied to a priori calibrated and
fringe-fitted data by self-calibration.
MG0414:
pdf
, or
text file
, or
statistical summary
.
0528+134:
pdf
, or
text file
, or
statistical summary
.
3C84:
pdf
, or
text file
, or
statistical summary
.
J0409+1217:
pdf
, or
text file
, or
statistical summary
.
J0422+0219:
pdf
, or
text file
, or
statistical summary
.
DA193:
pdf
, or
text file
, or
statistical summary
.
Comments.
As above, but for the post-SPLIT table SN2.
Telescope sensitivities
(the total AMP gain applied
during both a priori and self calibration; the square of this number gives the
antenna noise (SEFD) in Jy).
Comments.
CL4 gain-amp.
Residual closure phase (visibility closure phase with model closure phase subtracted) for:
MG0414
.
0528+134
.
3C84
.
J0409+1217
.
J0422+0219
.
DA193
.
Comments.
Separate files per (fringed) source, showing closure phase plots for all the triangles (not just Ef-*-* or Kp-*-*). Only stokes=I shown.
Calibrated visibilities and the source model of:
MG0414
.
0528+134
.
3C84
.
J0409+1217
.
J0422+0219
.
DA193
.
Comments.
For each (fringed) source, plots of amp/phase on Ef-* & Kp-* baselines, calibrated with (post-SPLIT) table CL3, with a model-line overplotted.
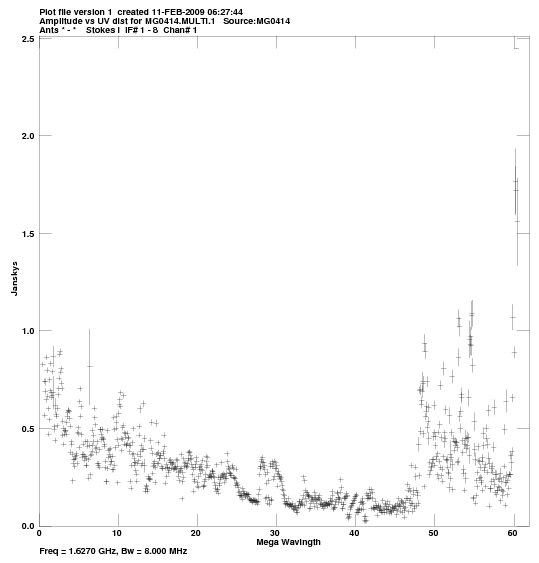
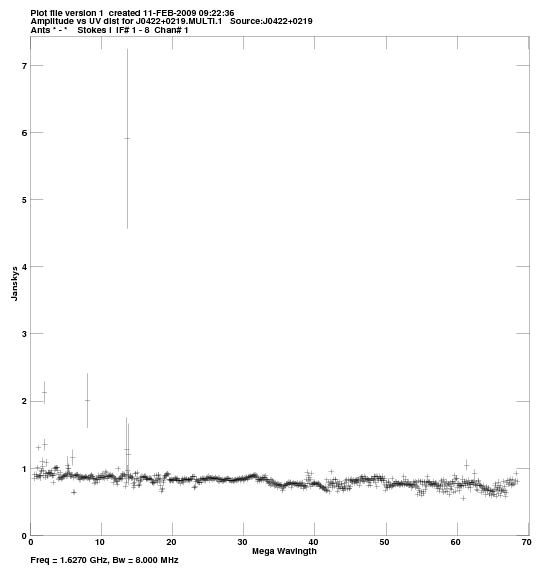
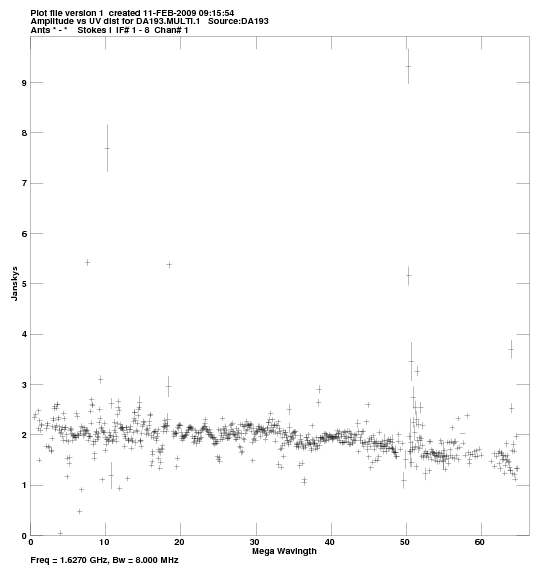
Calibrated visibilities against u,v distance for:
MG0414:
pdf
, or
png
.
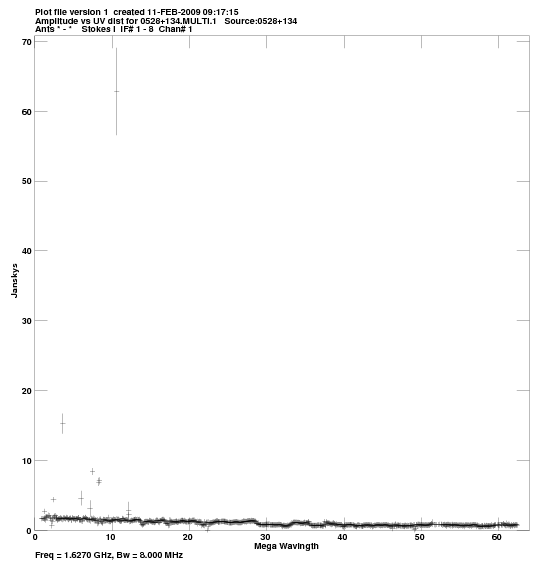
0528+134:
pdf
, or
png
.
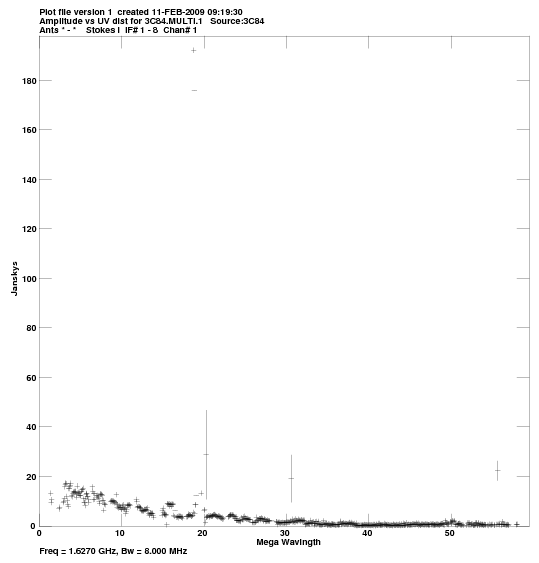
3C84:
pdf
, or
png
.
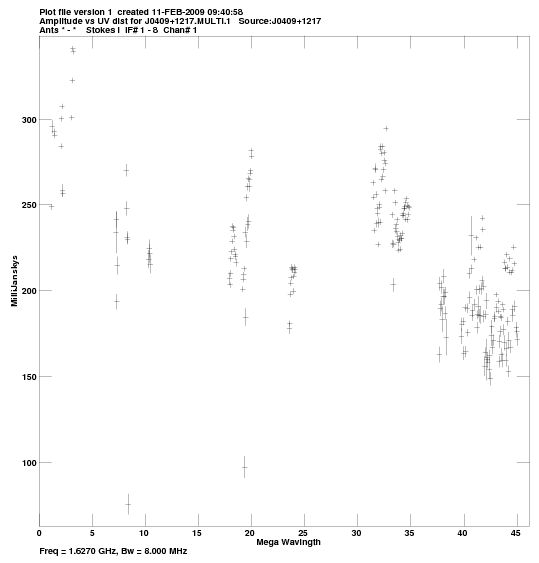
J0409+1217:
pdf
, or
png
.
J0422+0219:
pdf
, or
png
.
DA193:
pdf
, or
png
.
Comments.
For each source, a plot of amp vs. |uv| distance.
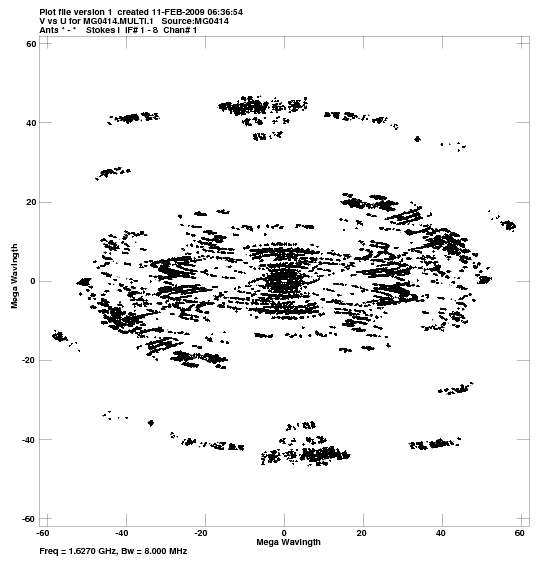
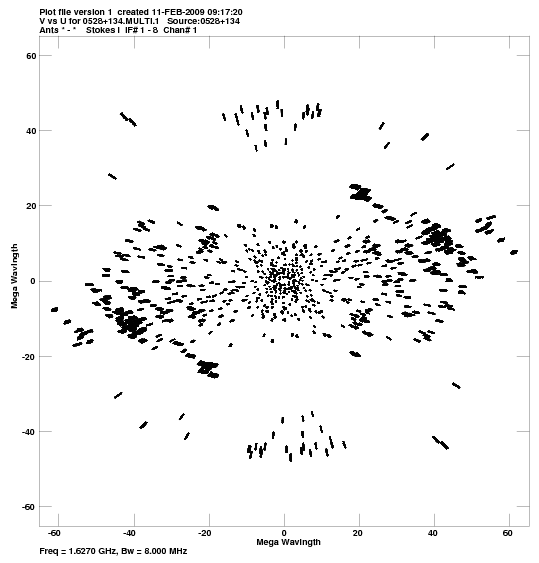
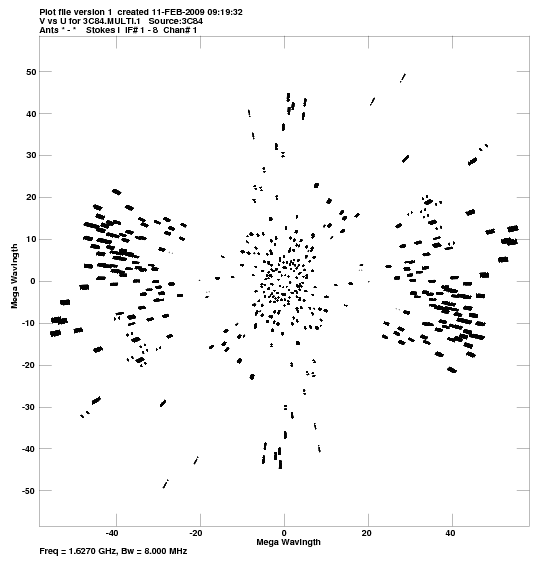
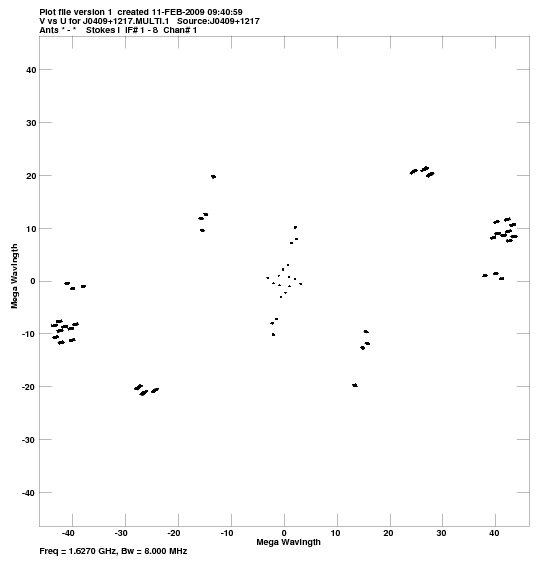
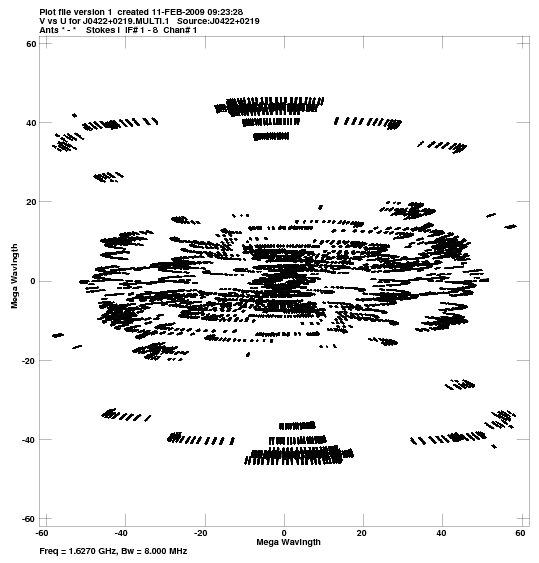
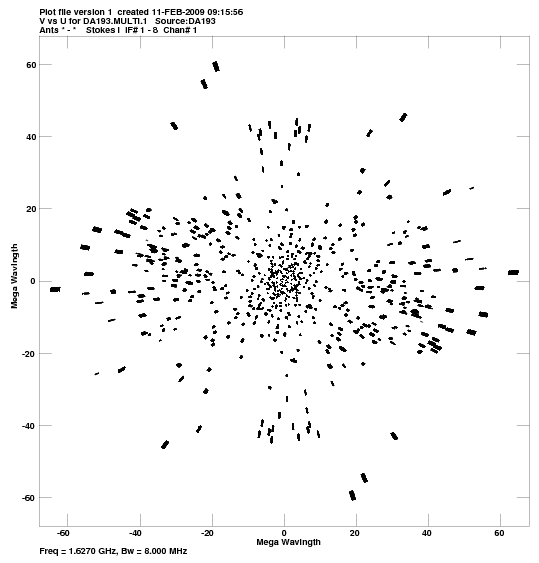
u,v coverage for:
MG0414:
pdf
, or
png
.
0528+134:
pdf
, or
png
.
3C84:
pdf
, or
png
.
J0409+1217:
pdf
, or
png
.
J0422+0219:
pdf
, or
png
.
DA193:
pdf
, or
png
.
Comments.
For each source, a plot of the u-v coverage.
Crude maps of sources:
MG0414:
pdf
, or
FITS
.
0528+134:
pdf
, or
FITS
.
3C84:
pdf
, or
FITS
.
J0409+1217:
pdf
, or
FITS
.
J0422+0219:
pdf
, or
FITS
.
DA193:
pdf
, or
FITS
.
Comments.
For each source, a CLEAN map resulting from the automated fringing and self-cal iterations (or phase-referencing) in the pipeline script.