
EVN User Experiment Pipeline Feedback
Last updated: Mon Oct 11 18:08:58 CEST 2010
yang@jive.nl
General Comments.
(
Brief data summary
and
scan listing
)
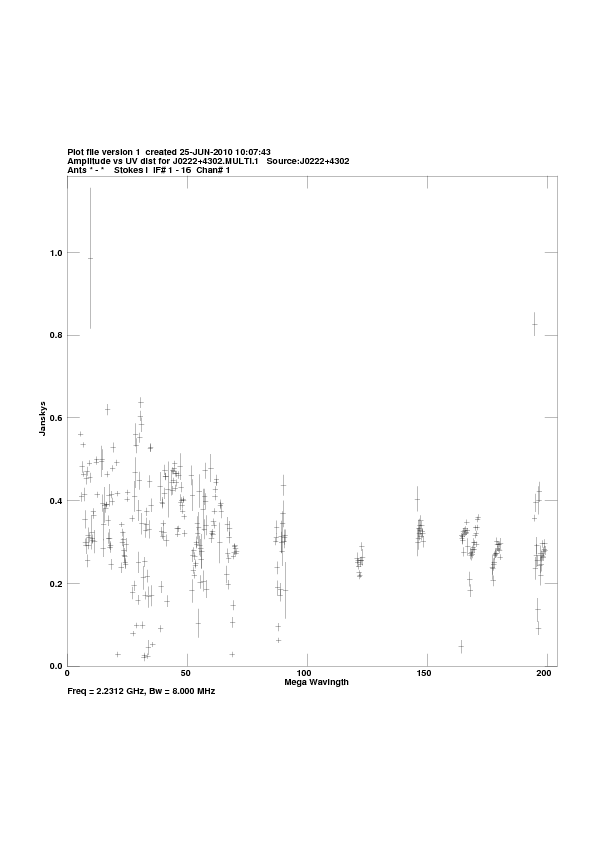
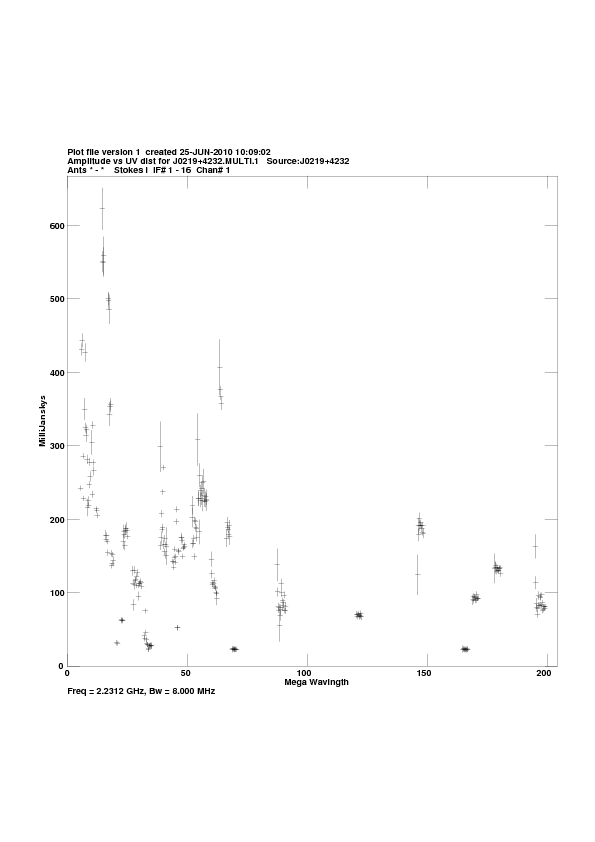
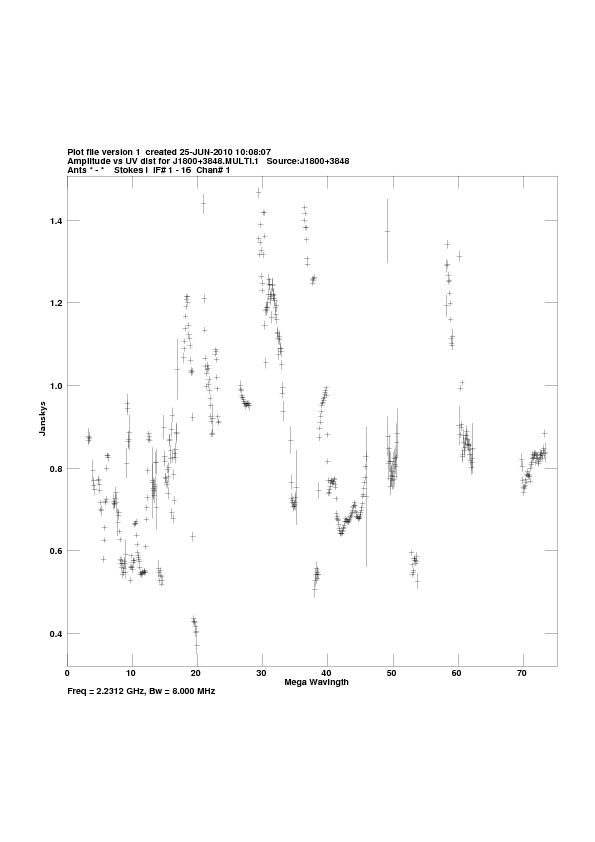
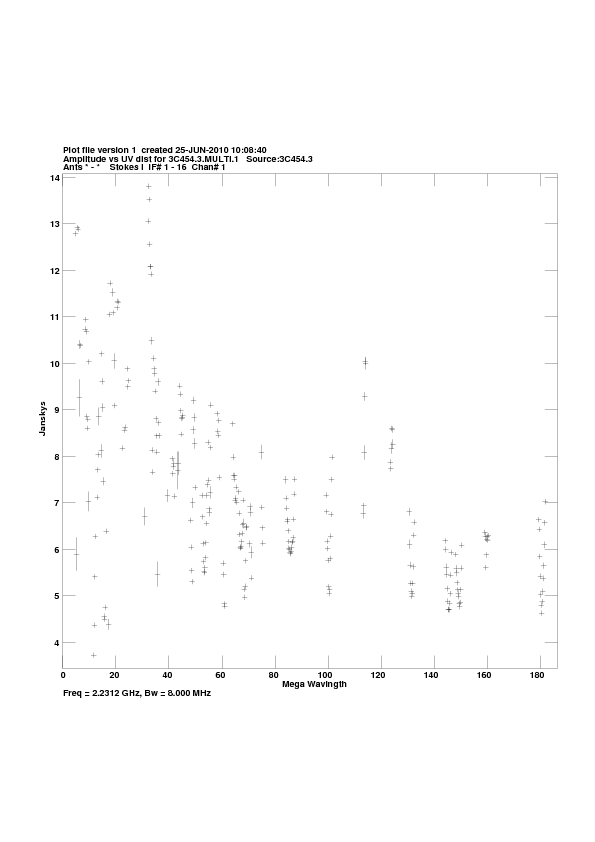
The S/X band NME experiment N10SX1 was performed on 23 Mar 2010. The experiment used 7 stations including two Russian stations (Bd and Zc) with a recording data rate of 512 Mbps (16 x 8 MHz, 2bit sampling, RCP only). IF 1 - 8 are S band data; IF 9 - 16 are X band data. In the pipelining, EF was used as the reference station, the sources J0219+4232, J0217+4216, and J0216+4240 were calibrated using the phase-referencing source J0222+4302. The other two sources 3C454.3 and J1800+3848 are fringe finders.
The EVN reliability indicator (ERI) for this experiment was
ERI = 1 . ERI* = 1 .
Participated stations are: Ys, Zc, Ef, Mc, Bd, On, and Nt.
Plots of the autocorrelations
Comments.
Each scan plotted separately, all stations. RFI: Zc in IF 3, 4, 5, 7 and 8; Mc and Ys in IF 3, Ef in IF4.
plots of the uncalibrated amplitude and phase
against time
Comments.
Full-experiment for Ef-* baselines, no calibration applied. A 12-second plot-averaging was used. During the phase-referecing observations, the fringes were not clear seen because the reference source J0222+4302 is not strong (unexpected from the VCS survey).
Plots of the uncalibrated amplitude and phase
against frequency channel
Comments.
Scalar averaged Ef-* baselines, each scan plotted separately. No calibration applied yet. Same clock model was used at S and X band. At S band, the delay is a bit of larger.
The uncalibrated amplitude and phase of the crosshand
correlations against frequency channel
(not available)
Comments.
TSYS against time
Comments.
TY1 table, each IF/pol on a separate plot. Bd and Zc used nominal SEFD.
Telescope sensitivities
from the a priori TSYS and Gain
curves (the square of this number gives the antenna noise (SEFD) in Jy - the
smaller the better).
Comments.
Gain amplitude from CL2 table.
Fringe-fit phase solutions
(including Parallactic
Angle correction).
Comments.
FRING_PHAS CL3 station phase solutions -- CL3 = CL2+SN2, thus also includes the initial amplitude/parallactic angle calibration from CL2 and the fringe solutions from SN2.
Fringe-fit delay solutions
Comments.
SN2 station delay solutions for the fringed sources, each IF/pol on a separate plot.
Fringe-fit rate solutions
Comments.
SN2 station rate solutions.
Telescope bandpasses
Comments.
Bandpass table 1. Bd shows slightly large amplitude variation across the band in some IFs.
Calibrated amplitude and phase against time
(a
priori amplitude calibration and fringe-fit solutions applied).
Comments.
Full-experiment for Ef-* baselines, calibrated with CL3.
Calibrated amplitude and phase against frequency
channel
Comments.
Ef-* baselines calibrated with CL3 and BP1. The amp and phase plots self-scale, not necessarily going down to 0 in the case of the amps.
Naturally weighted dirty map (not useful for bright sources)
produced before self-cal of:
J0216+4240:
pdf
, or
FITS
.
J0222+4302: pdf (not available)
, or
FITS (not available)
.
J0219+4232:
pdf
, or
FITS
.
J1800+3848: pdf (not available)
, or
FITS (not available)
.
3C454.3: pdf (not available)
, or
FITS (not available)
.
J0217+4216:
pdf
, or
FITS
.
Comments.
Uniformly weighted dirty map (not useful for bright sources)
produced before self-cal of:
J0216+4240:
pdf
, or
FITS
.
J0222+4302: pdf (not available)
, or
FITS (not available)
.
J0219+4232:
pdf
, or
FITS
.
J1800+3848: pdf (not available)
, or
FITS (not available)
.
3C454.3: pdf (not available)
, or
FITS (not available)
.
J0217+4216:
pdf
, or
FITS
.
Comments.
Phase corrections applied to a priori calibrated and
fringe-fitted data by self-calibration.
J0216+4240 (not available)
.
J0222+4302
.
J0219+4232 (not available)
.
J1800+3848
.
3C454.3
.
J0217+4216 (not available)
.
Comments.
Plots of post-SPLIT tables SN1 for the sources.
Amplitude corrections applied to a priori calibrated and
fringe-fitted data by self-calibration.
J0216+4240: pdf (not available)
, or
text file (not available)
, or
statistical summary (not available)
.
J0222+4302:
pdf
, or
text file
, or
statistical summary
.
J0219+4232: pdf (not available)
, or
text file (not available)
, or
statistical summary (not available)
.
J1800+3848:
pdf
, or
text file
, or
statistical summary
.
3C454.3:
pdf
, or
text file
, or
statistical summary
.
J0217+4216: pdf (not available)
, or
text file (not available)
, or
statistical summary (not available)
.
Comments.
As above, but for the post-SPLIT table SN2.
Telescope sensitivities
(the total AMP gain applied
during both a priori and self calibration; the square of this number gives the
antenna noise (SEFD) in Jy).
Comments.
CL4 gain-amp.
Residual closure phase (visibility closure phase with model closure phase subtracted) for:
J0216+4240 (not available)
.
J0222+4302
.
J0219+4232 (not available)
.
J1800+3848
.
3C454.3
.
J0217+4216 (not available)
.
Comments.
Separate files per (fringed) source, showing closure phase plots for all the triangles (not just Ef-*-*). Only stokes=I shown.
Calibrated visibilities and the source model of:
J0216+4240 (not available)
.
J0222+4302
.
J0219+4232 (not available)
.
J1800+3848
.
3C454.3
.
J0217+4216 (not available)
.
Comments.
For each (fringed) source, plots of amp/phase on Ef-* baselines, calibrated with (post-SPLIT) table CL3, with a model-line overplotted.
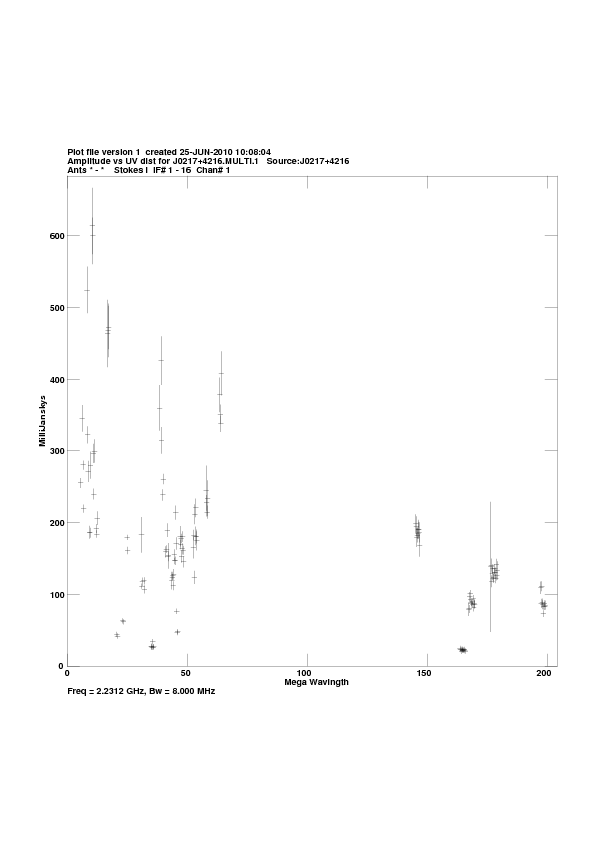
Calibrated visibilities against u,v distance for:
J0216+4240:
pdf
, or
png
.
J0222+4302:
pdf
, or
png
.
J0219+4232:
pdf
, or
png
.
J1800+3848:
pdf
, or
png
.
3C454.3:
pdf
, or
png
.
J0217+4216:
pdf
, or
png
.
Comments.
For each source, a plot of amp vs. |uv| distance at S and X band.
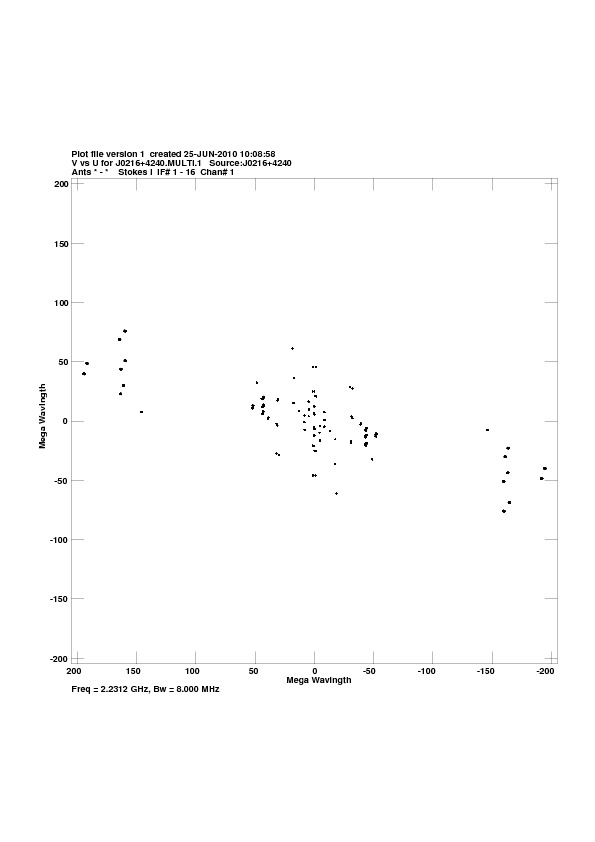
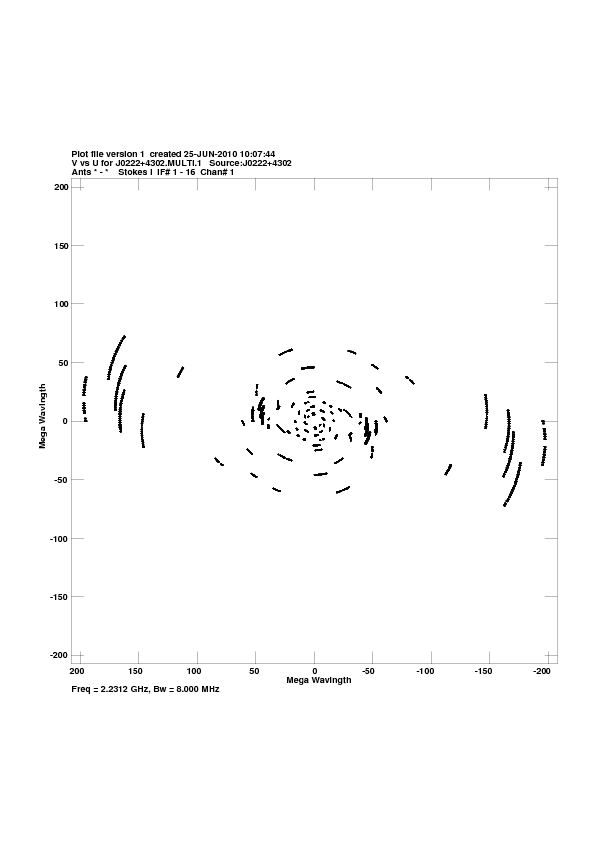
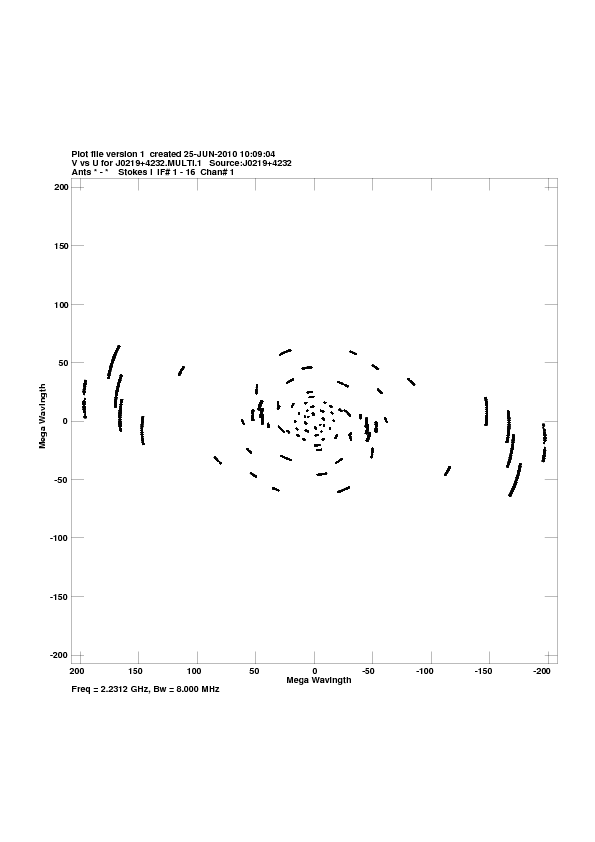
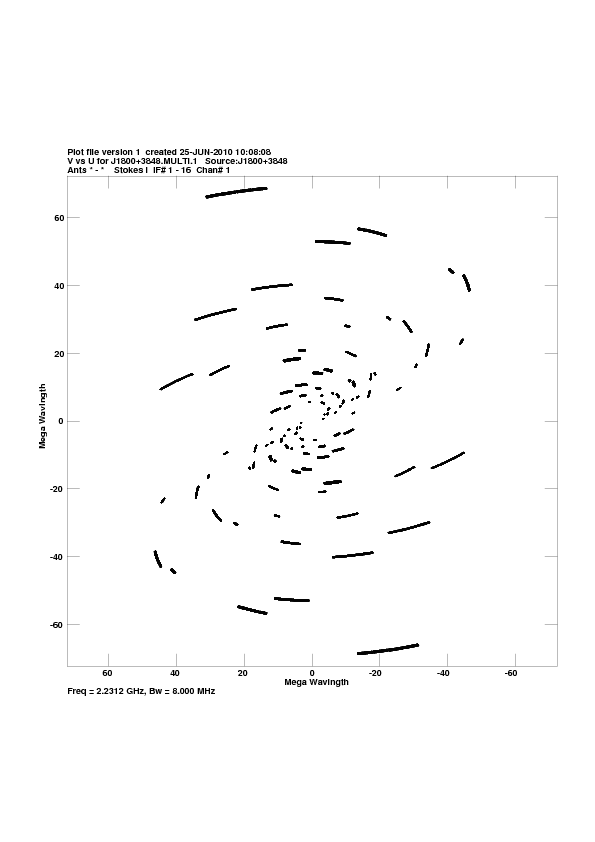
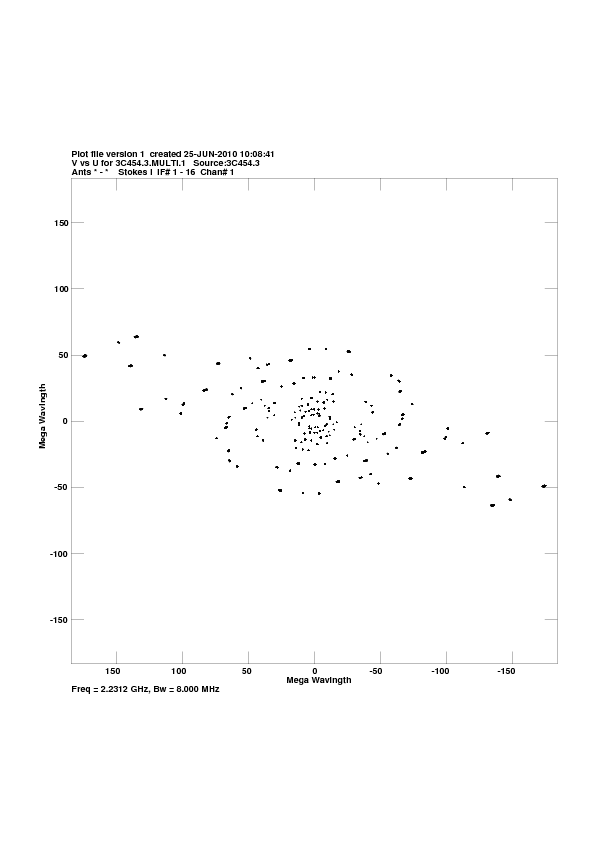
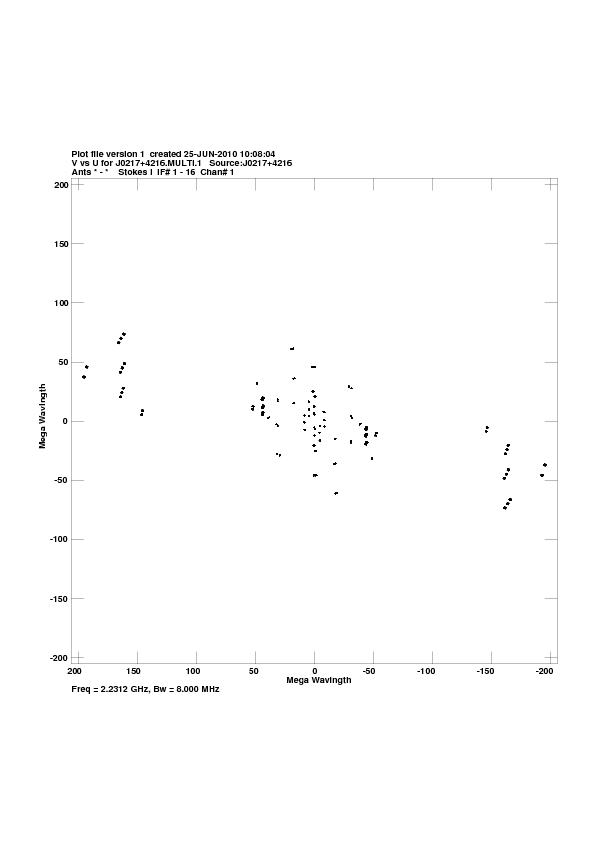
u,v coverage for:
J0216+4240:
pdf
, or
png
.
J0222+4302:
pdf
, or
png
.
J0219+4232:
pdf
, or
png
.
J1800+3848:
pdf
, or
png
.
3C454.3:
pdf
, or
png
.
J0217+4216:
pdf
, or
png
.
Comments.
For each source, a plot of the u-v coverage. Note that Both S and X band u-v coverage were ploted in the same image.
Crude maps of sources:
J0216+4240:
pdf
, or
FITS
.
J0222+4302:
pdf
, or
FITS
.
J0219+4232:
pdf
, or
FITS
.
J1800+3848:
pdf
, or
FITS
.
3C454.3:
pdf
, or
FITS
.
J0217+4216:
pdf
, or
FITS
.
Comments.
Note that both S and X band data were used to make the crude image. For each source, a CLEAN map resulting from the automated fringing and self-cal iterations (or phase-referencing) in the pipeline script.