
EVN User Experiment Pipeline Feedback
Last updated: Wed Aug 7 16:18:19 CEST 2013
surcis@jive.nl
General Comments.
(
Brief data summary
and
scan listing
)
N13K2 had 19 stations (including DBBC from On, Nt, Tr, and Hh that are listed here as Od, Nd, Td, and Hd respectively), 8 x 16 MHz IFs, 4 polarizations, two-bit sampling, and used 64 frequency points per IF/pol, with 2s integrations. The SOLINT was set at 1.0 min. Ef was used as the reference station. The fringe-finder and bandpass calibrator was 'J1310+3220'. The continuum target source 'J0923+3849' was calibrated using the phase-reference source '4C39.25'.
The EVN reliability indicator (ERI) for this experiment was
ERI = 0.84 . ERI* = 0.84 .
(EF=1, JB=1, MC=1, NT=1, TR=0.68, YS=0.17, MH=1, ZC=1, BD=1, UR=1, SH=1, HH=1, KY=0.70, KU=1, KT=1, OD=1, ND=1, TD=1, HD=0.93)
Plots of the autocorrelations
Comments.
Each scan plotted separately, all stations. OD, ND, TD, and HD are also plotted here. Many RFIs for ZC (only LCP). RFI in IF2 for HH (stronger in RCP than in LCP). Strange bandpasses for ND, TD, and HD.
plots of the uncalibrated amplitude and phase
against time
Comments.
Full-experiment for Ef-* baselines, no calibration applied. OD, ND and TD are also plotted here. No fringes for MH. YS and SH show fringes only towards the end of the experiment. TR and TD show fringes only after the 40 minutes. NT and ND observed only LCP.
Plots of the uncalibrated amplitude and phase
against frequency channel
Comments.
Scalar averaged Ef-* baselines, each scan plotted separately. No calibration applied yet. OD, ND, TD, and HD are also plotted here.
The uncalibrated amplitude and phase of the crosshand
correlations against frequency channel
Comments.
Scalar averaged Ef-* baselines for LR, each scan plotted separately. No calibration applied yet. OD, ND, TD, and HD are also plotted here.
TSYS against time
Comments.
TY1 table, each IF/pol on a separate plot.
Telescope sensitivities
from the a priori TSYS and Gain
curves (the square of this number gives the antenna noise (SEFD) in Jy - the
smaller the better).
Comments.
Gain amplitude from CL2 table. Gain value for MC only if considered POLY=1.0000E+00. No gain curve available for ND and TD.
Fringe-fit phase solutions
(including Parallactic
Angle correction).
Comments.
CL3 station phase solutions -- CL3 = CL2+SN2, thus also includes the initial amplitude/parallactic angle calibration from CL2 and the fringe solutions from SN2. MH does not have solutions.
Fringe-fit delay solutions
Comments.
SN2 station delay solutions for the fringed sources, each IF/pol on a separate. MH does not have solutions. plot.
Fringe-fit rate solutions
Comments.
SN2 station rate solutions. MH does not have solutions.
Telescope bandpasses
Comments.
Bandpass table 1. J1310+3220 were used for bandpass calibration.
Calibrated amplitude and phase against time
(a
priori amplitude calibration and fringe-fit solutions applied).
Comments.
Full-experiment for Ef-* baselines, calibrated with CL3.
Calibrated amplitude and phase against frequency
channel
Comments.
Ef-* baselines calibrated with CL3 and BP1. The amp and phaseplots self-scale, not necessarily going down to 0 in the case of the amps.
Naturally weighted dirty map (not useful for bright sources)
produced before self-cal of:
J1310+3220: pdf (not available)
, or
FITS (not available)
.
4C39.25:
pdf
, or
FITS
.
J0923+3849:
pdf
, or
FITS
.
Comments.
Naturally weighted dirty map of the targets.
Uniformly weighted dirty map (not useful for bright sources)
produced before self-cal of:
J1310+3220: pdf (not available)
, or
FITS (not available)
.
4C39.25:
pdf
, or
FITS
.
J0923+3849:
pdf
, or
FITS
.
Comments.
Uniformly weighted dirty map of the targets.
Phase corrections applied to a priori calibrated and
fringe-fitted data by self-calibration.
J1310+3220
.
4C39.25
.
J0923+3849
.
Comments.
Plots of post-SPLIT tables SN1 for the sources.
Amplitude corrections applied to a priori calibrated and
fringe-fitted data by self-calibration.
J1310+3220:
pdf
, or
text file
, or
statistical summary
.
4C39.25:
pdf
, or
text file
, or
statistical summary
.
J0923+3849:
pdf
, or
text file
, or
statistical summary
.
Comments.
As above, but for the post-SPLIT table SN2.
Telescope sensitivities
(the total AMP gain applied
during both a priori and self calibration; the square of this number gives the
antenna noise (SEFD) in Jy).
Comments.
CL4 gain-amp.
Residual closure phase (visibility closure phase with model closure phase subtracted) for:
J1310+3220
.
4C39.25
.
J0923+3849
.
Comments.
Separate files per (fringed) source, showing closure phase plots for all the triangles (not just Ef-*-*). Only stokes=I shown.
Calibrated visibilities and the source model of:
J1310+3220
.
4C39.25
.
J0923+3849
.
Comments.
For each (fringed) source, plots of amp/phase on Ef-* baselines, calibrated with (post-SPLIT) table CL3, with a model-line overplotted.
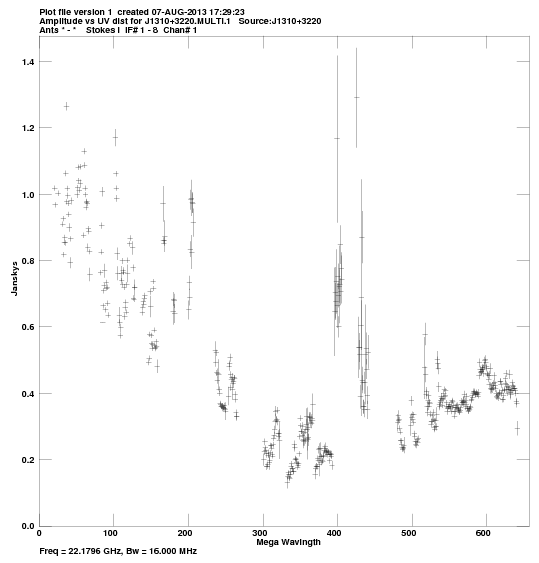
Calibrated visibilities against u,v distance for:
J1310+3220:
pdf
, or
png
.
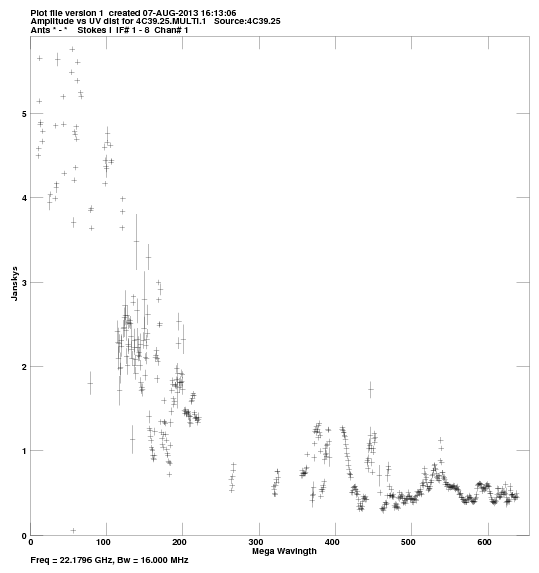
4C39.25:
pdf
, or
png
.
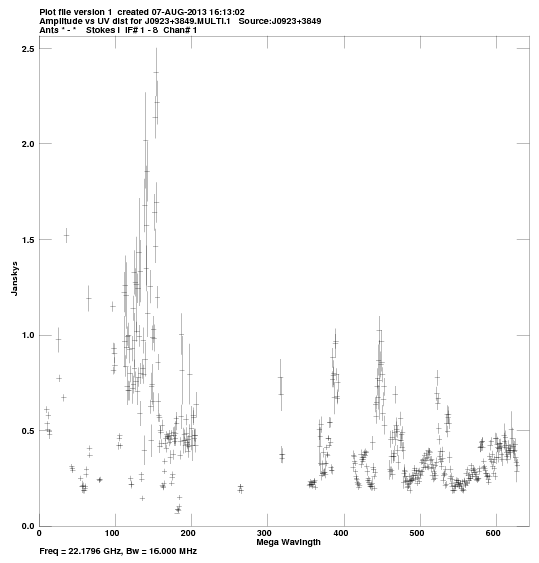
J0923+3849:
pdf
, or
png
.
Comments.
For each source, a plot of amp vs. |uv| distance.
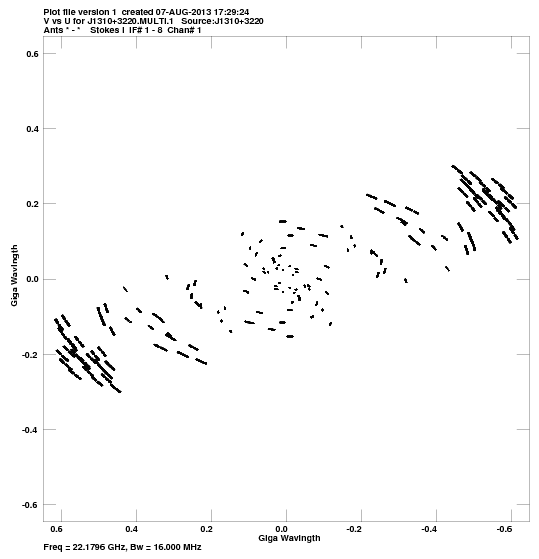
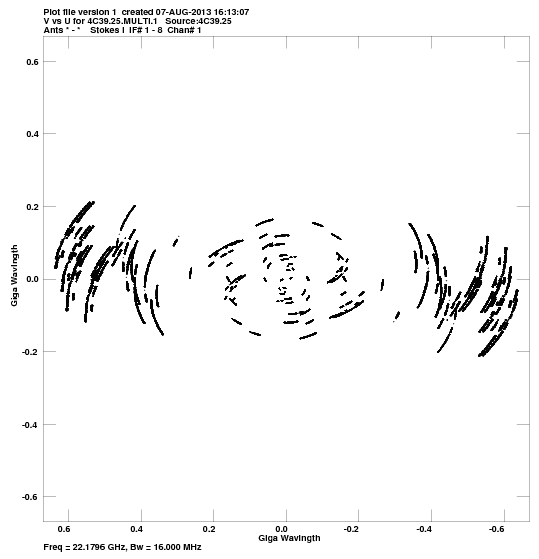
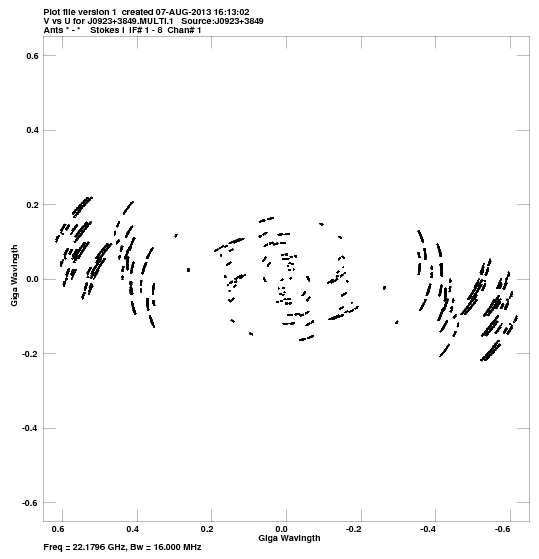
u,v coverage for:
J1310+3220:
pdf
, or
png
.
4C39.25:
pdf
, or
png
.
J0923+3849:
pdf
, or
png
.
Comments.
For each source, a plot of the u-v coverage.
Crude maps of sources:
J1310+3220:
pdf
, or
FITS
.
4C39.25:
pdf
, or
FITS
.
J0923+3849:
pdf
, or
FITS
.
Comments.
For each source, a CLEAN map resulting from the automated fringing and self-cal iterations (or phase-referencing) in the pipeline script.