
EVN User Experiment Pipeline Feedback
Last updated: Mon Sep 1 13:12:28 CEST 2014
surcis@jive.nl
General Comments.
(
Brief data summary
and
scan listing
)
N14K2 had 16 stations (including DBBC from Ys that is listed here as Yd), 8 x 16 MHz IFs, 4 polarizations, two-bit sampling, and used 64 frequency points per IF/pol, with 2s integrations. The SOLINT was set at 1.0 min. Ef was used as the reference station. The fringe-finder and bandpass calibrator was '0836+710'. No phase-referencing observations were included.
The EVN reliability indicator (ERI) for this experiment was
ERI = 0.74 . ERI* = 0.74 .
(EF=0.96, JB=0.5 (fringes for half of the NME), ON=1, NT=1, TR=1, SV=1, ZC=0.5 (fringes for half of the NME), BD=1, SH=1, YS=1, MH=1, SR=1, KY=0.90, KU=1, KT=0 (no data), YD=1)
Plots of the autocorrelations
Comments.
Each scan plotted separately, all stations. Yd is also plotted here. On shows a discontinuous bandpass in scan 1 for IFs #1 (RR;sb0) and #2 (RR;sb1). Zc has strong RFIs in IF1 (both RR and LL).
plots of the uncalibrated amplitude and phase
against time
Comments.
Full-experiment for Ef-* baselines, no calibration applied. Yd is also plotted here. Weak fringes for JB, and Zc.
Plots of the uncalibrated amplitude and phase
against frequency channel
Comments.
Scalar averaged Ef-* baselines, each scan plotted separately. No calibration applied yet. Yd is also plotted here. Sr shows spiky bandpasses in all IFs (both RR and LL).
The uncalibrated amplitude and phase of the crosshand
correlations against frequency channel
Comments.
Scalar averaged Ef-* baselines for LR, each scan plotted separately. No calibration applied yet. Yd is also plotted here.
TSYS against time
Comments.
TY1 table, each IF/pol on a separate plot.
Telescope sensitivities
from the a priori TSYS and Gain
curves (the square of this number gives the antenna noise (SEFD) in Jy - the
smaller the better).
Comments.
Gain amplitude from CL2 table.
Fringe-fit phase solutions
(including Parallactic
Angle correction).
Comments.
CL3 station phase solutions -- CL3 = CL2+SN2, thus also includes the initial amplitude/parallactic angle calibration from CL2 and the fringe solutions from SN2.
Fringe-fit delay solutions
Comments.
SN2 station delay solutions for the fringed sources, each IF/pol on a separate.
Fringe-fit rate solutions
Comments.
SN2 station rate solutions.
Telescope bandpasses
Comments.
Bandpass table 1.
Calibrated amplitude and phase against time
(a
priori amplitude calibration and fringe-fit solutions applied).
Comments.
Full-experiment for Ef-* baselines, calibrated with CL3. Sr shows a flux close to zero.
Calibrated amplitude and phase against frequency
channel
Comments.
Ef-* baselines calibrated with CL3 and BP1. The amp and phaseplots self-scale, not necessarily going down to 0 in the case of the amps.
Naturally weighted dirty map (not useful for bright sources)
produced before self-cal of:
0836+710: pdf (not available)
, or
FITS (not available)
.
Comments.
Naturally weighted dirty map of the targets.
Uniformly weighted dirty map (not useful for bright sources)
produced before self-cal of:
0836+710: pdf (not available)
, or
FITS (not available)
.
Comments.
Uniformly weighted dirty map of the targets.
Phase corrections applied to a priori calibrated and
fringe-fitted data by self-calibration.
0836+710
.
Comments.
Plots of post-SPLIT tables SN1 for the sources.
Amplitude corrections applied to a priori calibrated and
fringe-fitted data by self-calibration.
0836+710:
pdf
, or
text file
, or
statistical summary
.
Comments.
As above, but for the post-SPLIT table SN2.
Telescope sensitivities
(the total AMP gain applied
during both a priori and self calibration; the square of this number gives the
antenna noise (SEFD) in Jy).
Comments.
CL4 gain-amp.
Residual closure phase (visibility closure phase with model closure phase subtracted) for:
0836+710
.
Comments.
Separate files per (fringed) source, showing closure phase plots for all the triangles (not just Ef-*-*). Only stokes=I shown.
Calibrated visibilities and the source model of:
0836+710
.
Comments.
For each (fringed) source, plots of amp/phase on Ef-* baselines, calibrated with (post-SPLIT) table CL3, with a model-line overplotted.
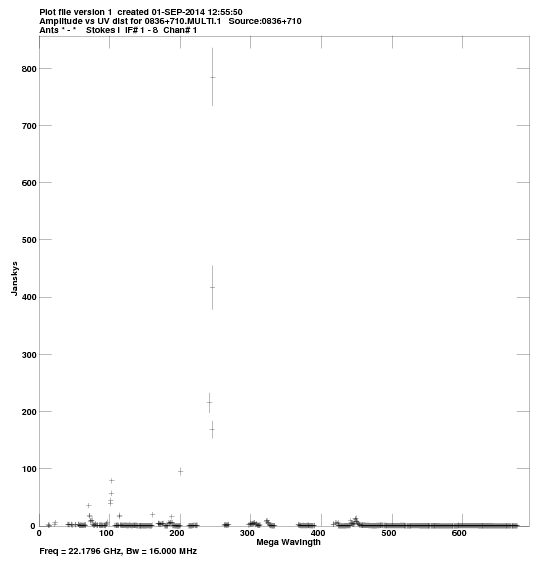
Calibrated visibilities against u,v distance for:
0836+710:
pdf
, or
png
.
Comments.
For each source, a plot of amp vs. |uv| distance.
u,v coverage for:
0836+710:
pdf
, or
png
.
Comments.
For each source, a plot of the u-v coverage.
Crude maps of sources:
0836+710:
pdf
, or
FITS
.
Comments.
For each source, a CLEAN map resulting from the automated fringing and self-cal iterations (or phase-referencing) in the pipeline script.