
EVN User Experiment Pipeline Feedback
Last updated: Wed Aug 20 15:20:08 CEST 2014
surcis@jive.nl
General Comments.
(
Brief data summary
and
scan listing
)
N14M2 had 12 stations (including DBBC from T6, and Ys which are listed as Td, and Yd, respectively), 16 x 8 MHz IFs, 4 polarizations, and used 64 frequency points per IF/pol, with 2s integrations. The SOLINT was set at 1.0 min. Ef was used as reference station. The fringe-finder and bandpass calibrator was '3C286', '3C345', and 'J1310+3220'. The continuum target sources 'J1329+3154' and 'J1640+3946' were calibrated using the phase-reference sources '3C286' and '3C345', respectively.
The EVN reliability indicator (ERI) for this experiment was
ERI = 1.00 . ERI* = 1.00 .
(EF=1, WB=1, JB=1, ON=1, NT=1, TR=1, YS=1, SH=1, Sr=1, T6=1, TD=1, YD=1)
Plots of the autocorrelations
Comments.
Each scan plotted separately, all stations. TD and YD are also plotted here. T6: difference of amplitude between even and odd IFs in scan #01.
plots of the uncalibrated amplitude and phase
against time
Comments.
Full-experiment for Ef-* baselines, no calibration applied.TD and YD are also plotted here.
Plots of the uncalibrated amplitude and phase
against frequency channel
Comments.
Scalar averaged Ef-* baselines, each scan plotted separately. No calibration applied yet. TD and YD are also plotted here. YD show a difference in amplitude between RR and LL.
The uncalibrated amplitude and phase of the crosshand
correlations against frequency channel
Comments.
Scalar averaged Ef-* baselines for LR, each scan plotted separately. No calibration applied yet. TD and YD are also plotted here.
TSYS against time
Comments.
TY1 table, each IF/pol on a separate plot.
Telescope sensitivities
from the a priori TSYS and Gain
curves (the square of this number gives the antenna noise (SEFD) in Jy - the
smaller the better).
Comments.
Gain amplitude from CL2 table.
Fringe-fit phase solutions
(including Parallactic
Angle correction).
Comments.
CL3 station phase solutions -- CL3 = CL2+SN2, thus also includes the initial amplitude/parallactic angle calibration from CL2 and the fringe solutions from SN2.
Fringe-fit delay solutions
Comments.
SN2 station delay solutions for the fringed sources, each IF/pol on a separate plot.
Fringe-fit rate solutions
Comments.
SN2 station rate solutions.
Telescope bandpasses
Comments.
Bandpass table 1.
Calibrated amplitude and phase against time
(a
priori amplitude calibration and fringe-fit solutions applied).
Comments.
Full-experiment for Ef-* baselines, calibrated with CL3.
Calibrated amplitude and phase against frequency
channel
Comments.
Ef-* baselines calibrated with CL3 and BP1. The amp and phaseplots self-scale, not necessarily going down to 0 in the case of the amps. T6: a big jump in the amplitude between odd and even IFs during first scan.
Naturally weighted dirty map (not useful for bright sources)
produced before self-cal of:
3C345:
pdf
, or
FITS
.
J1329+3154:
pdf
, or
FITS
.
J1310+3220: pdf (not available)
, or
FITS (not available)
.
3C286:
pdf
, or
FITS
.
J1640+3946:
pdf
, or
FITS
.
Comments.
Naturally weighted dirty map of the targets.
Uniformly weighted dirty map (not useful for bright sources)
produced before self-cal of:
3C345:
pdf
, or
FITS
.
J1329+3154:
pdf
, or
FITS
.
J1310+3220: pdf (not available)
, or
FITS (not available)
.
3C286:
pdf
, or
FITS
.
J1640+3946:
pdf
, or
FITS
.
Comments.
Uniformly weighted dirty map of the targets.
Phase corrections applied to a priori calibrated and
fringe-fitted data by self-calibration.
3C345
.
J1329+3154
.
J1310+3220
.
3C286
.
J1640+3946
.
Comments.
Plots of post-SPLIT tables SN1 for the sources.
Amplitude corrections applied to a priori calibrated and
fringe-fitted data by self-calibration.
3C345:
pdf
, or
text file
, or
statistical summary
.
J1329+3154:
pdf
, or
text file
, or
statistical summary
.
J1310+3220:
pdf
, or
text file
, or
statistical summary
.
3C286:
pdf
, or
text file
, or
statistical summary
.
J1640+3946:
pdf
, or
text file
, or
statistical summary
.
Comments.
As above, but for the post-SPLIT table SN2.
Telescope sensitivities
(the total AMP gain applied
during both a priori and self calibration; the square of this number gives the
antenna noise (SEFD) in Jy).
Comments.
CL4 gain-amp.
Residual closure phase (visibility closure phase with model closure phase subtracted) for:
3C345
.
J1329+3154
.
J1310+3220
.
3C286
.
J1640+3946
.
Comments.
Separate files per (fringed) source, showing closure phase plots for all the triangles (not just Ef-*-*). Only stokes=I shown.
Calibrated visibilities and the source model of:
3C345
.
J1329+3154
.
J1310+3220
.
3C286
.
J1640+3946
.
Comments.
For each (fringed) source, plots of amp/phase on Ef-* baselines, calibrated with (post-SPLIT) table CL3, with a model-line overplotted.
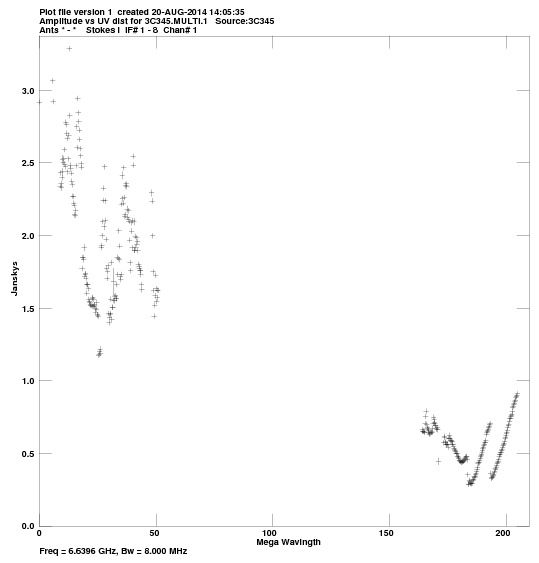
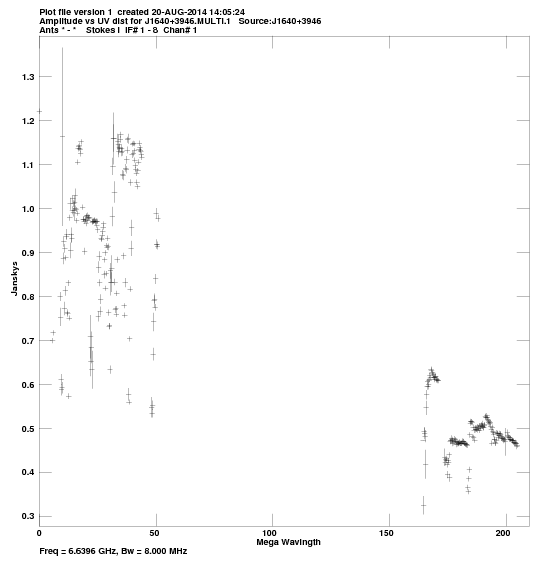
Calibrated visibilities against u,v distance for:
3C345:
pdf
, or
png
.
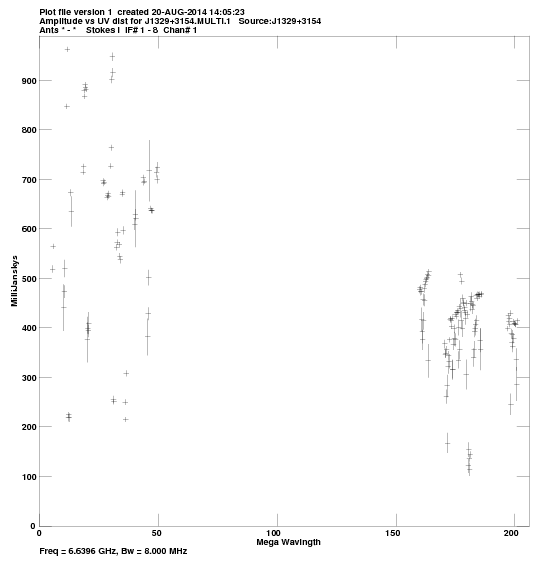
J1329+3154:
pdf
, or
png
.
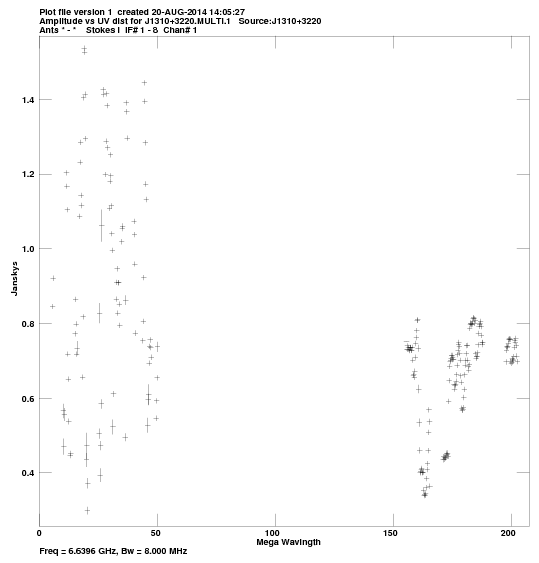
J1310+3220:
pdf
, or
png
.
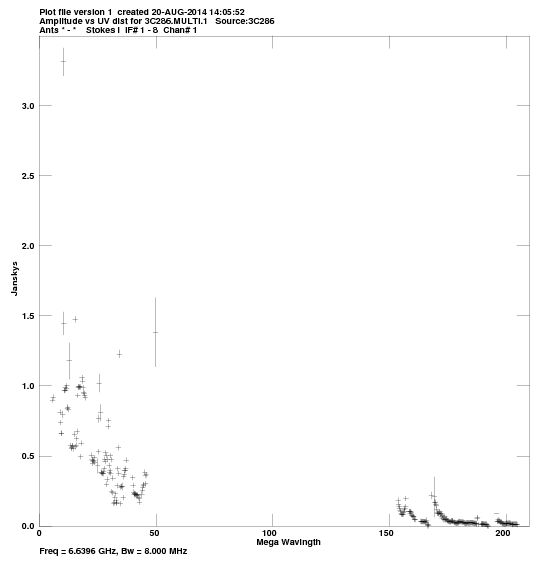
3C286:
pdf
, or
png
.
J1640+3946:
pdf
, or
png
.
Comments.
For each source, a plot of amp vs. |uv| distance.
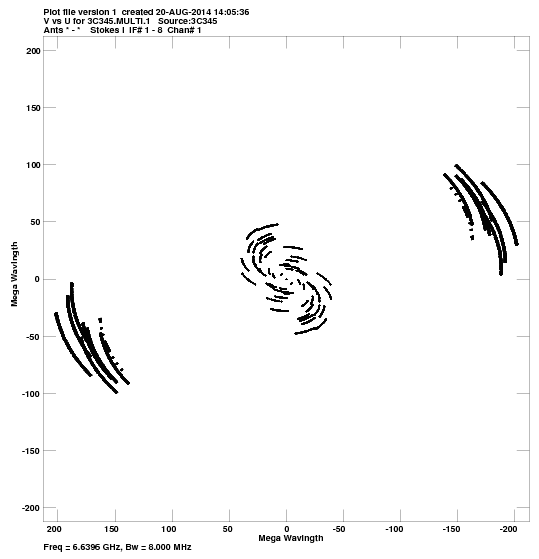
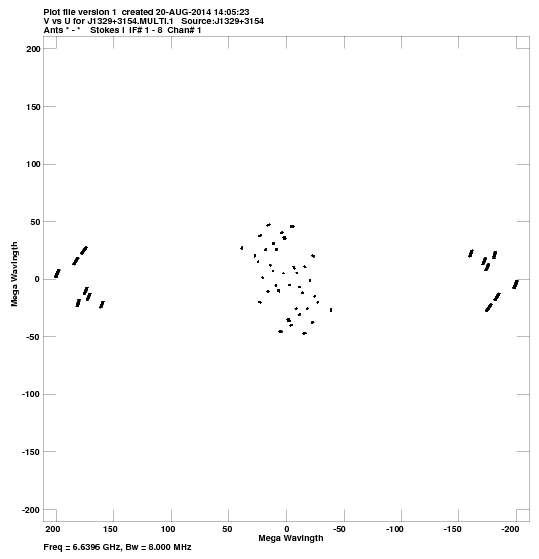
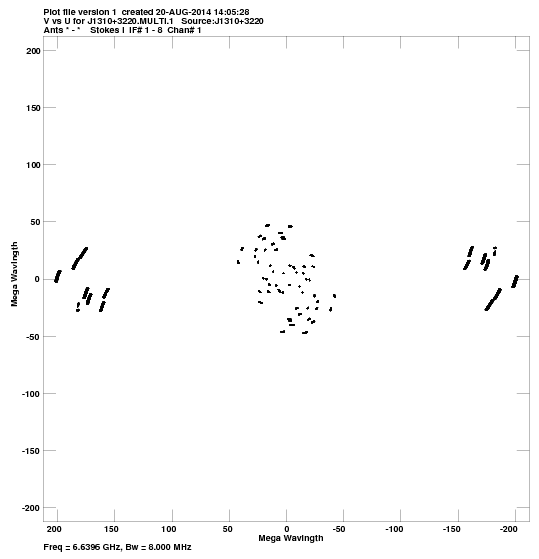
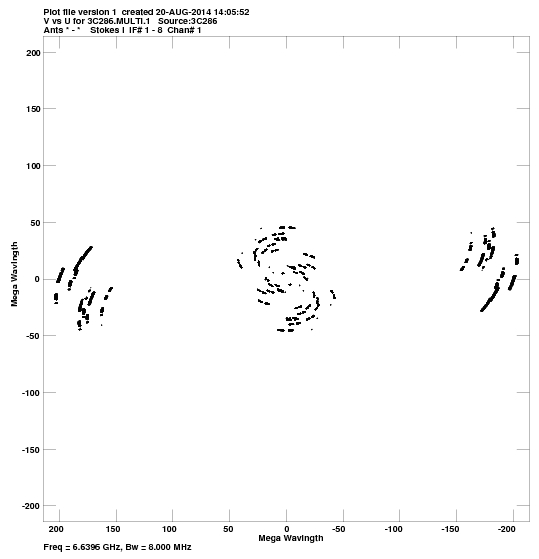
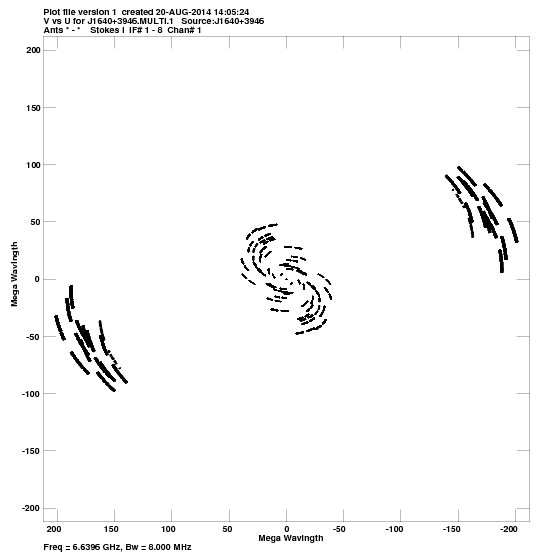
u,v coverage for:
3C345:
pdf
, or
png
.
J1329+3154:
pdf
, or
png
.
J1310+3220:
pdf
, or
png
.
3C286:
pdf
, or
png
.
J1640+3946:
pdf
, or
png
.
Comments.
For each source, a plot of the u-v coverage.
Crude maps of sources:
3C345:
pdf
, or
FITS
.
J1329+3154:
pdf
, or
FITS
.
J1310+3220:
pdf
, or
FITS
.
3C286:
pdf
, or
FITS
.
J1640+3946:
pdf
, or
FITS
.
Comments.
For each source, a CLEAN map resulting from the automated fringing and self-cal iterations (or phase-referencing) in the pipeline script.