
EVN User Experiment Pipeline Feedback
Last updated: Mon Nov 9 18:09:39 CET 2015
mao@jive.eu
General Comments.
(
Brief data summary
and
scan listing
)
C band (6cm) NME, observed on 4 Mar 2015. Data rate was 512 Mbps (8 X 8 MHz subbands, dual polarization, two-bit sampling). The observation comprises integrations on strong calibrators (3C84, 0234+285, DA193) for ftp-fringe tests and phase-reference cycles with a continuum source (J0225+2955) as a target. 14 stations scheduled, however only 12 stations recorded data.
The EVN reliability indicator (ERI) for this experiment was
ERI = 0.61 . ERI* = 0.61 .
The ERI* value takes into account that:
- Sh & Ur did not record data for this experiment due to other commitments.
- Wb had a backend problem and did not observe from 1323 - 1500UT.
- Ys had a LO problem and did not observe from 1200 - 1315UT.
The ERI value also takes into account losses that are outside the station's control, of which there were none for this experiment.
Plots of the autocorrelations
Comments.
Each scan plotted separately, all stations.
plots of the uncalibrated amplitude and phase
against time
Comments.
Full-experiment for Ef-* baselines, no calibration applied. A 1.5 minute plot-averaging was used.
Plots of the uncalibrated amplitude and phase
against frequency channel
Comments.
Scalar averaged Ef-* baselines, each scan plotted separately. No calibration applied yet.
The uncalibrated amplitude and phase of the crosshand
correlations against frequency channel
Comments.
There are cross-pols for this?! There's something odd with IF 6LR EF-JB.
TSYS against time
Comments.
TY1 table, each IF/pol on a separate plot. SV, ZC, and BD receive "default" antab values.
Telescope sensitivities
from the a priori TSYS and Gain
curves (the square of this number gives the antenna noise (SEFD) in Jy - the
smaller the better).
Comments.
Gain amplitude from CL2 table.
Fringe-fit phase solutions
(including Parallactic
Angle correction).
Comments.
CL3 station phase solutions -- CL3 = CL2+SN2, thus also includes the initial amplitude/parallactic angle calibration from CL2 and the fringe solutions from SN2.
Fringe-fit delay solutions
Comments.
SN2 station delay solutions for the fringed sources, each IF/pol on a separate plot.
Fringe-fit rate solutions
Comments.
SN2 station rate solutions.
Telescope bandpasses
Comments.
Bandpass table 1. 3C84 and DA193 were used for bandpass calibration. NT L looks a bit odd. TR IF2L is bad.
Calibrated amplitude and phase against time
(a
priori amplitude calibration and fringe-fit solutions applied).
Comments.
Full-experiment for Ef-* baselines, calibrated with CL3. A 1.5 minute plot-averaging was used.
Calibrated amplitude and phase against frequency
channel
Comments.
Ef-* baselines calibrated with CL3 and BP1. The amp and phase plots self-scale, not necessarily going down to 0 in the case of the amps. It looks like WB is bad in IFs 4,6,8 for both pols. NT L has odd structure. TR IF2L is bad.
Naturally weighted dirty map (not useful for bright sources)
produced before self-cal of:
J0225+2955:
pdf
, or
FITS
.
DA193: pdf (not available)
, or
FITS (not available)
.
0234+285: pdf (not available)
, or
FITS (not available)
.
3C84: pdf (not available)
, or
FITS (not available)
.
Comments.
Naturally weighted dirty maps of phase-referenced sources. Detected.
Uniformly weighted dirty map (not useful for bright sources)
produced before self-cal of:
J0225+2955:
pdf
, or
FITS
.
DA193: pdf (not available)
, or
FITS (not available)
.
0234+285: pdf (not available)
, or
FITS (not available)
.
3C84: pdf (not available)
, or
FITS (not available)
.
Comments.
Uniformly weighted dirty maps of phase-referenced sources. Detected.
Phase corrections applied to a priori calibrated and
fringe-fitted data by self-calibration.
J0225+2955 (not available)
.
DA193
.
0234+285
.
3C84
.
Comments.
Plots of post-SPLIT tables SN1 for the sources that have been individually fringed.
Amplitude corrections applied to a priori calibrated and
fringe-fitted data by self-calibration.
J0225+2955: pdf (not available)
, or
text file (not available)
, or
statistical summary (not available)
.
DA193:
pdf
, or
text file
, or
statistical summary
.
0234+285:
pdf
, or
text file
, or
statistical summary
.
3C84:
pdf
, or
text file
, or
statistical summary
.
Comments.
As above, but for the post-SPLIT table SN2.
Telescope sensitivities
(the total AMP gain applied
during both a priori and self calibration; the square of this number gives the
antenna noise (SEFD) in Jy).
Comments.
CL4 gain-amp.
Residual closure phase (visibility closure phase with model closure phase subtracted) for:
J0225+2955 (not available)
.
DA193
.
0234+285
.
3C84
.
Comments.
Separate files per (fringed) source, showing closure phase plots for all the triangles. Only stokes=I shown.
Calibrated visibilities and the source model of:
J0225+2955 (not available)
.
DA193
.
0234+285
.
3C84
.
Comments.
For each (fringed) source, plots of amp/phase on Ef-* baselines, calibrated with (post-SPLIT) table CL3, with a model-line overplotted.
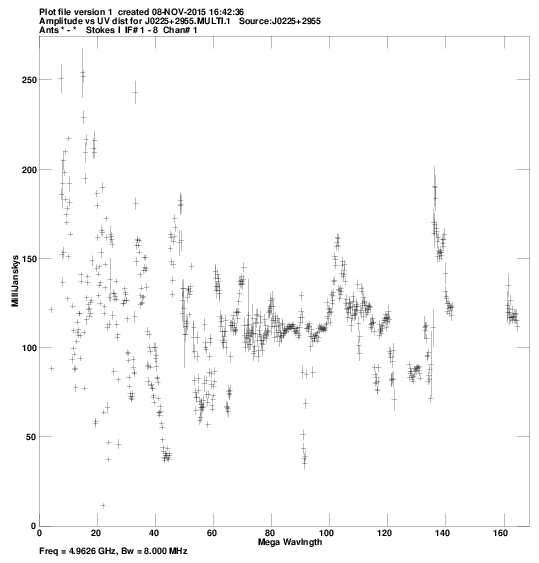
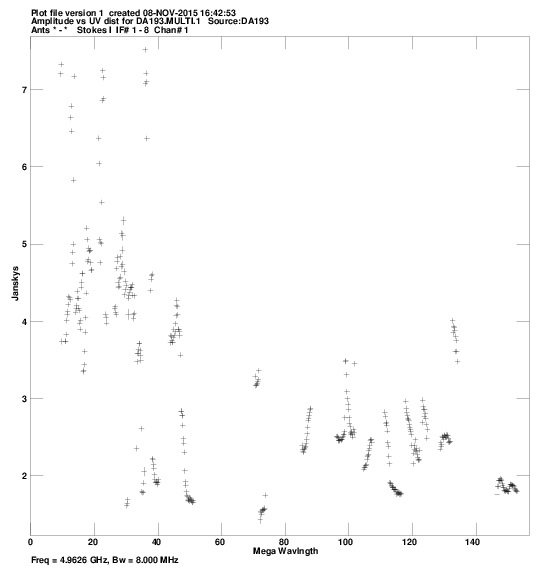
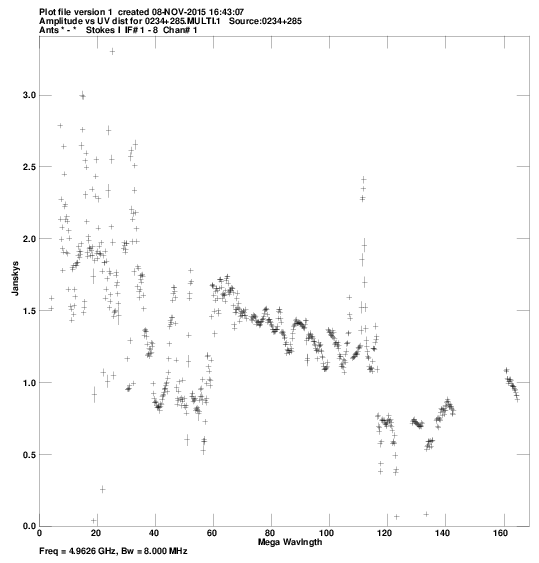
Calibrated visibilities against u,v distance for:
J0225+2955:
pdf
, or
png
.
DA193:
pdf
, or
png
.
0234+285:
pdf
, or
png
.
3C84:
pdf
, or
png
.
Comments.
For each source, a plot of amp vs. |uv| distance. Some bad data still present. But at least there aren't any sources with _more_ flux in the longer baselines !
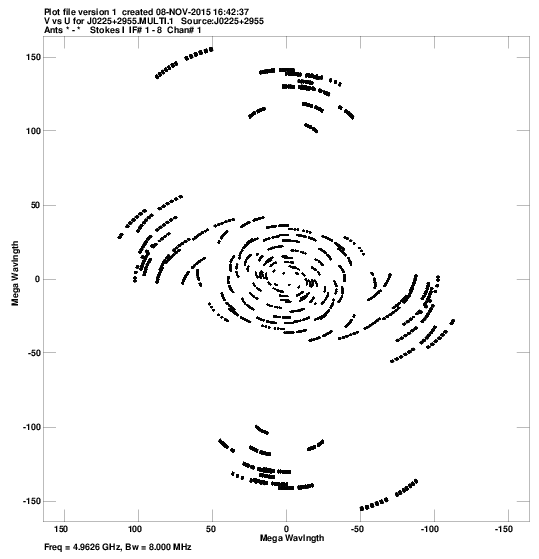
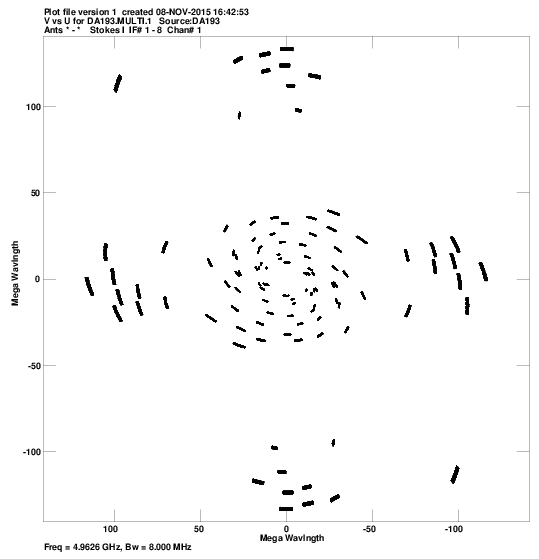
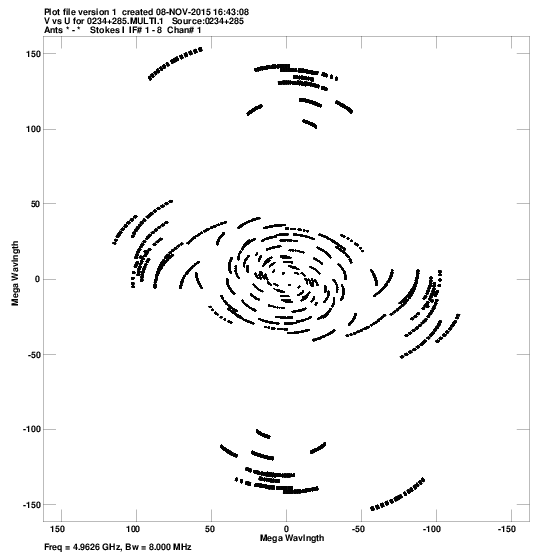
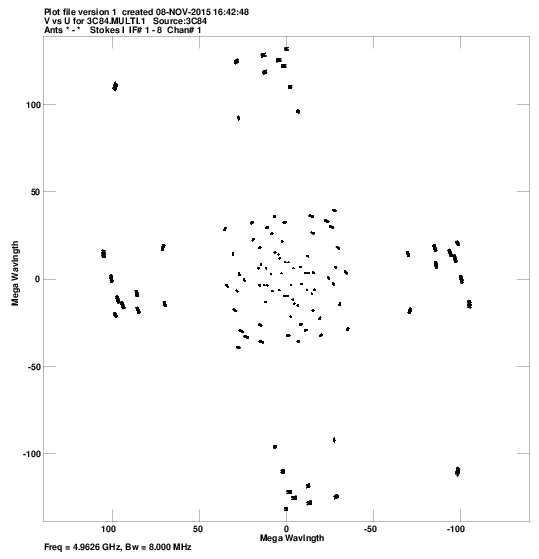
u,v coverage for:
J0225+2955:
pdf
, or
png
.
DA193:
pdf
, or
png
.
0234+285:
pdf
, or
png
.
3C84:
pdf
, or
png
.
Comments.
For each source, a plot of the u-v coverage.
Crude maps of sources:
J0225+2955:
pdf
, or
FITS
.
DA193:
pdf
, or
FITS
.
0234+285:
pdf
, or
FITS
.
3C84:
pdf
, or
FITS
.
Comments.
For each source, a CLEAN map resulting from the automated fringing and self-cal iterations (or phase-referencing) in the pipeline script.