
EVN User Experiment Pipeline Feedback
Last updated: Tue Jun 4 16:40:03 CEST 2013
campbell@jive.nl
General Comments.
(
Brief data summary
and
scan listing
)
RL005 had 7 good stations, 8 16MHz IFs, 2 polarizations, 128 frequency points per IF/pol, and 1s integrations. Considerably more information is included in the experiment's cover letter on the standard-plots portion of the EVN Archive. In the pipelining, the target sources were treated as phase-reference targets and were not separately fringe-fit. The SOLINT was set automatically to a value commensurate with a typical reference-source scan (~120s) Ef, and then Wb, and then Tr were used as the reference stations (Ef missed IF8 until 1317, Wb was out of HA range until 1200, Tr seemed the 3rd-most sensitive station).
The EVN reliability indicator (ERI) for this experiment was
ERI = 0.608 . ERI* = 0.660 .
The losses include Ef missing IF8 for the first 2.25hr, On missing 50min, Nt missing IF7-8/RCP fringes, and Jb entirely (if not discounting Jb, the ERI would have been 0.862. The ERI also includes loss of the Iridium-affected portion of IF2 (as flagged in the pipeline), which ERI* does not count (i.e., treating it as "weather" -- not discounting Jb would have left the ERI* at 0.935).
Plots of the autocorrelations
Comments.
Each scan plotted separately, all stations.
plots of the uncalibrated amplitude and phase
against time
Comments.
Full-experiment for Ef-* baselines, no calibration applied. A 2 minute plot-averaging was used.
Plots of the uncalibrated amplitude and phase
against frequency channel
Comments.
Scalar averaged Ef-* baselines, each scan plotted separately. No calibration applied yet.
The uncalibrated amplitude and phase of the crosshand
correlations against frequency channel
(not available)
Comments.
TSYS against time
Comments.
TY1 table, each IF/pol on a separate plot. The extra power seen by the individual stations towards the Crab nebula is evident (follows through to the GAIN and SENS plots).
Telescope sensitivities
from the a priori TSYS and Gain
curves (the square of this number gives the antenna noise (SEFD) in Jy - the
smaller the better).
Comments.
Gain amplitude from CL2 table.
Fringe-fit phase solutions
(including Parallactic
Angle correction).
Comments.
CL3 station phase solutions -- CL3 = CL2+SN2, thus also includes the initial amplitude/parallactic angle calibration from CL2 and the fringe solutions from SN2.
Fringe-fit delay solutions
Comments.
SN2 station delay solutions for the fringed sources, each IF/pol on a separate plot. Outliers in Nt IF2/LCP. Discontinuities at the times of (automatic) reference-station changes.
Fringe-fit rate solutions
Comments.
SN2 station rate solutions.
Telescope bandpasses
Comments.
Bandpass table 1. J0530+1331 was used for bandpass calibration.
Calibrated amplitude and phase against time
(a
priori amplitude calibration and fringe-fit solutions applied).
Comments.
Full-experiment for Ef-* baselines, calibrated with CL3. The 2-min plot-averaging still applied.
Calibrated amplitude and phase against frequency
channel
Comments.
Ef-* baselines calibrated with CL3 and BP1. The amp and phase plots self-scale, not necessarily going down to 0 in the case of the amps.
Naturally weighted dirty map (not useful for bright sources)
produced before self-cal of:
J0530+1331: pdf (not available)
, or
FITS (not available)
.
CRAB-PSR:
pdf
, or
FITS
.
J0518+2054: pdf (not available)
, or
FITS (not available)
.
Comments.
Naturally-weighted dirty maps of the phase-referenced-to sources.
Uniformly weighted dirty map (not useful for bright sources)
produced before self-cal of:
J0530+1331: pdf (not available)
, or
FITS (not available)
.
CRAB-PSR:
pdf
, or
FITS
.
J0518+2054: pdf (not available)
, or
FITS (not available)
.
Comments.
Uniformly-weighted dirty maps of the phase-referenced-to sources.
Phase corrections applied to a priori calibrated and
fringe-fitted data by self-calibration.
J0530+1331
.
CRAB-PSR (not available)
.
J0518+2054
.
Comments.
Plots of post-SPLIT tables SN1 for the sources that have been individually fringed.
Amplitude corrections applied to a priori calibrated and
fringe-fitted data by self-calibration.
J0530+1331:
pdf
, or
text file
, or
statistical summary
.
CRAB-PSR: pdf (not available)
, or
text file (not available)
, or
statistical summary (not available)
.
J0518+2054:
pdf
, or
text file
, or
statistical summary
.
Comments.
As above, but for the post-SPLIT table SN2.
Telescope sensitivities
(the total AMP gain applied
during both a priori and self calibration; the square of this number gives the
antenna noise (SEFD) in Jy).
Comments.
CL4 gain-amp.
Residual closure phase (visibility closure phase with model closure phase subtracted) for:
J0530+1331
.
CRAB-PSR (not available)
.
J0518+2054
.
Comments.
Separate files per (fringed) source, showing closure phase plots for all the triangles. Only stokes=I shown.
Calibrated visibilities and the source model of:
J0530+1331
.
CRAB-PSR (not available)
.
J0518+2054
.
Comments.
For each (fringed) source, plots of amp/phase on Ef-* baselines, calibrated with (post-SPLIT) table CL3, with a model-line overplotted.
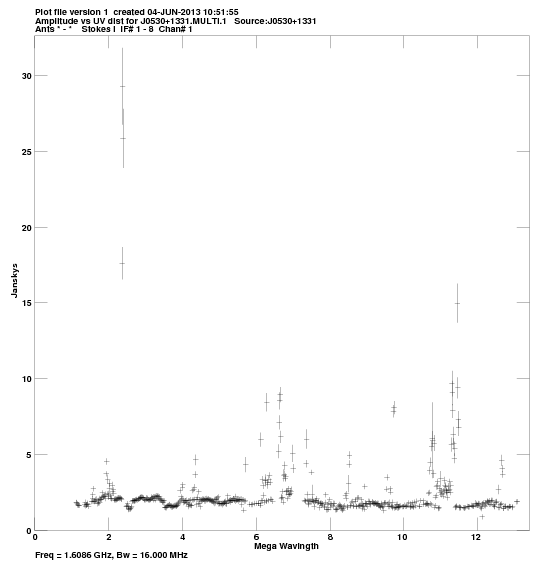
Calibrated visibilities against u,v distance for:
J0530+1331:
pdf
, or
png
.
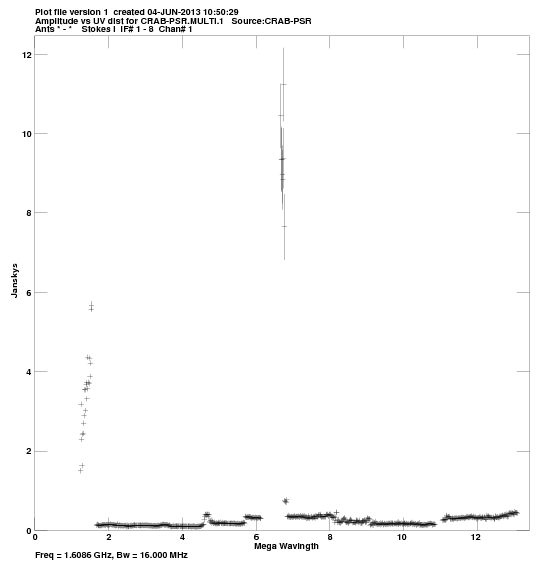
CRAB-PSR:
pdf
, or
png
.
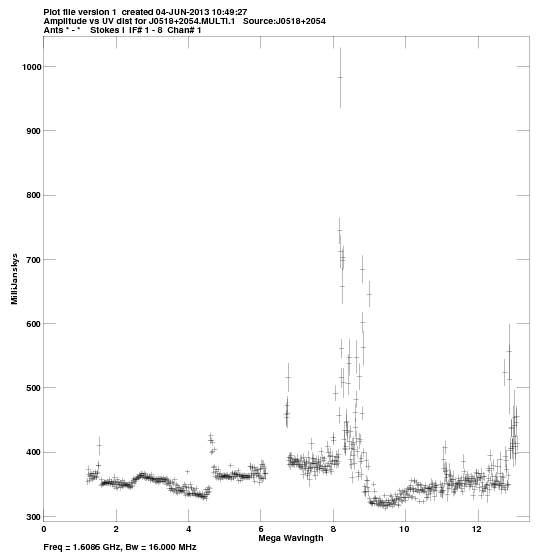
J0518+2054:
pdf
, or
png
.
Comments.
For each source, a plot of amp vs. |uv| distance. Some egregious outliers on the high-flux side for each of the sources.
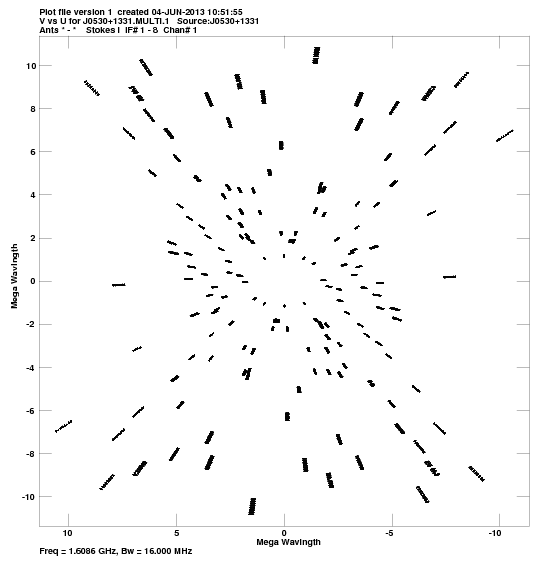
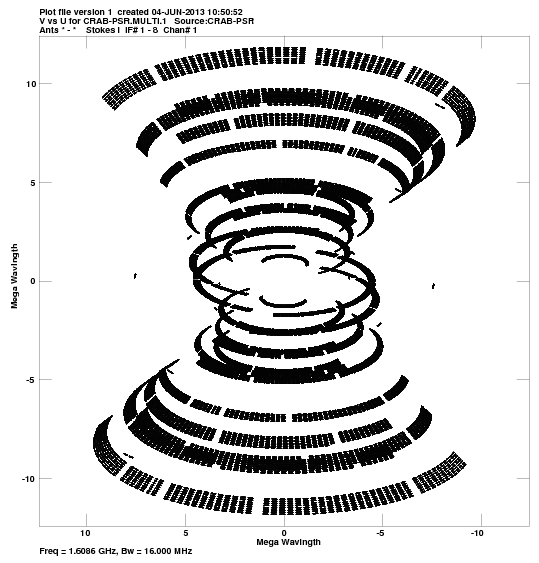
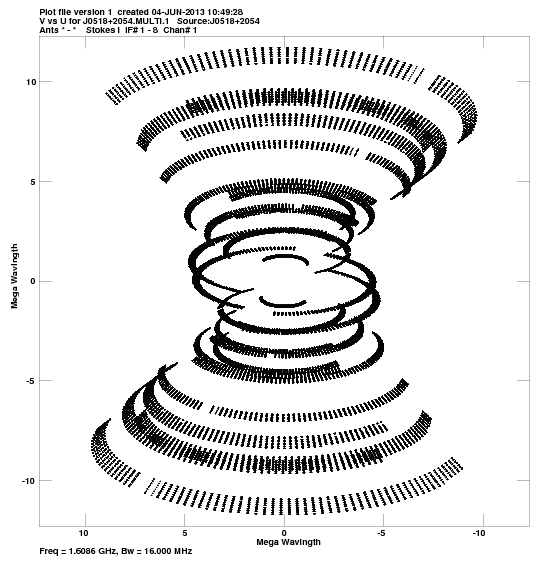
u,v coverage for:
J0530+1331:
pdf
, or
png
.
CRAB-PSR:
pdf
, or
png
.
J0518+2054:
pdf
, or
png
.
Comments.
For each source, a plot of the u-v coverage.
Crude maps of sources:
J0530+1331:
pdf
, or
FITS
.
CRAB-PSR:
pdf
, or
FITS
.
J0518+2054:
pdf
, or
FITS
.
Comments.
For each source, a CLEAN map resulting from the automated fringing and self-cal iterations (or phase-referencing) in the pipeline script.