
EVN User Experiment Pipeline Feedback
Last updated: Fri Oct 28 10:39:27 CEST 2016
campbell@jive.eu
General Comments.
(
Brief data summary
and
scan listing
)
EG078E had 10 good stations (Bd eventually flagged entirely in the pipelinig), 8 16MHz IFs, 2 polarizations, 32 frequency points per IF/pol, and 3s integrations (per phase-center). Considerably more information is included in the experiment's cover letter on the standard-plots portion of the EVN Archive. This pipelining corresponds to the first multiple phase-center output (target HDFC0155), which is the only one containing the non-target scans. In the pipelining, the target was treated as phase-reference target and wwas not separately fringe-fit. The SOLINT was set automatically to a value commensurate with a typical reference-source scan. Ef, then T6, and then O8 were used as the reference stations (T6 to cover the RCP missing from Ef; O8 to cover RCP in the time-range in which the sources were down for T6).
The EVN reliability indicator (ERI) for this experiment was
ERI = 0.518 . ERI* = 0.759 if Bd problems were RFI; 0.603 if not. .
ERISTAR does not include weather effects, under which I'm also including the known RFI that led to IF flagging at Mc (IF1,2,8), Sv (IF1), and Tr (IF6). ERI includes all losses. Flagging all of Bd is computed both as RFI (not in ERISTAR) and not (in ERISTAR). Ef's missing RCP, Tr's missing the last 8.5 hours and late starts at O8 and Zc go into ERISTAR.
Plots of the autocorrelations
Comments.
Each scan plotted separately, all stations.
Plots of the uncalibrated amplitude and phase
against time
Comments.
Full-experiment for Ef-* & O8-* baselines, no calibration applied. A 1.5 minute plot-averaging was used.
Plots of the uncalibrated amplitude and phase
against frequency channel
Comments.
Scalar averaged Ef-* & O8-* baselines, each scan plotted separately. No calibration applied yet.
The uncalibrated amplitude and phase of the crosshand
correlations against frequency channel
(not available)
Comments.
TSYS against time
Comments.
TY1 table, each IF/pol on a separate plot. There was a fair amount of editing done on the apriori ANTAB file during the course of pipelining. An apparent error in the linear term of Bd's gain curve polynomial coefficients was fixed (5.22e-2 --> 5.22e-3). Tsys values from the field-system logs for Jb were unphysically scattered, so unity Tsys were used along with DPFU = reciprocal noninal SEFD. Patches of unphyscial Tsys >10k K were edited out from individual channels for Mc, Ur, T6.
Telescope sensitivities
from the a priori TSYS and Gain
curves (the square of this number gives the antenna noise (SEFD) in Jy - the
smaller the better).
Comments.
Gain amplitude from CL2 table.
Fringe-fit phase solutions
(including Parallactic
Angle correction).
Comments.
CL3 station phase solutions -- CL3 = CL2+SN2, thus also includes the initial amplitude/parallactic angle calibration from CL2 and the fringe solutions from SN2.
Fringe-fit delay solutions
Comments.
SN2 station delay solutions for the fringed sources, each IF/pol on a separate plot. The different behavior for the RR & LL pols of T6 & O8 correspond to their becoming the reference station in RR at various times.
Fringe-fit rate solutions
Comments.
SN2 station rate solutions. Same comment about T6 & O8 RR & LL behaviour as for the FRING_DELAY plot.
Telescope bandpasses
Comments.
Bandpass table 1. DA193, 3C345, J1241+602 were used for bandpass calibration (J1241 was needed because Tr missed both scans of the actual fringe-finders.
Calibrated amplitude and phase against time
(a
priori amplitude calibration and fringe-fit solutions applied).
Comments.
Full-experiment for Ef-* & O8-* baselines, calibrated with CL3. The 1.5-min plot-averaging still applied.
Calibrated amplitude and phase against frequency
channel
Comments.
Ef-* & O8-* baselines calibrated with CL3 and BP1. The amp and phase plots self-scale, not necessarily going down to 0 in the case of the amps.
Naturally weighted dirty map (not useful for bright sources)
produced before self-cal of:
J1234+619: pdf (not available)
, or
FITS (not available)
.
DA193: pdf (not available)
, or
FITS (not available)
.
3C345: pdf (not available)
, or
FITS (not available)
.
J1241+602: pdf (not available)
, or
FITS (not available)
.
HDFC0155:
pdf
, or
FITS
.
Comments.
Naturally-weighted dirty maps of the phase-referenced-to sources.
Uniformly weighted dirty map (not useful for bright sources)
produced before self-cal of:
J1234+619: pdf (not available)
, or
FITS (not available)
.
DA193: pdf (not available)
, or
FITS (not available)
.
3C345: pdf (not available)
, or
FITS (not available)
.
J1241+602: pdf (not available)
, or
FITS (not available)
.
HDFC0155:
pdf
, or
FITS
.
Comments.
Uniformly-weighted dirty maps of the phase-referenced-to sources.
Phase corrections applied to a priori calibrated and
fringe-fitted data by self-calibration.
J1234+619
.
DA193
.
3C345
.
J1241+602
.
HDFC0155 (not available)
.
Comments.
Plots of post-SPLIT tables SN1 for the sources that have been individually fringed.
Amplitude corrections applied to a priori calibrated and
fringe-fitted data by self-calibration.
J1234+619:
pdf
, or
text file
, or
statistical summary
.
DA193:
pdf
, or
text file
, or
statistical summary
.
3C345:
pdf
, or
text file
, or
statistical summary
.
J1241+602:
pdf
, or
text file
, or
statistical summary
.
HDFC0155: pdf (not available)
, or
text file (not available)
, or
statistical summary (not available)
.
Comments.
As above, but for the post-SPLIT table SN2.
Telescope sensitivities
(the total AMP gain applied
during both a priori and self calibration; the square of this number gives the
antenna noise (SEFD) in Jy).
Comments.
CL4 gain-amp.
Residual closure phase (visibility closure phase with model closure phase subtracted) for:
J1234+619
.
DA193
.
3C345
.
J1241+602
.
HDFC0155 (not available)
.
Comments.
Separate files per (fringed) source, showing closure phase plots for all the triangles. Only stokes=I shown.
Calibrated visibilities and the source model of:
J1234+619
.
DA193
.
3C345
.
J1241+602
.
HDFC0155 (not available)
.
Comments.
For each (fringed) source, plots of amp/phase on Ef-* & O8-* baselines, calibrated with (post-SPLIT) table CL3, with a model-line overplotted.
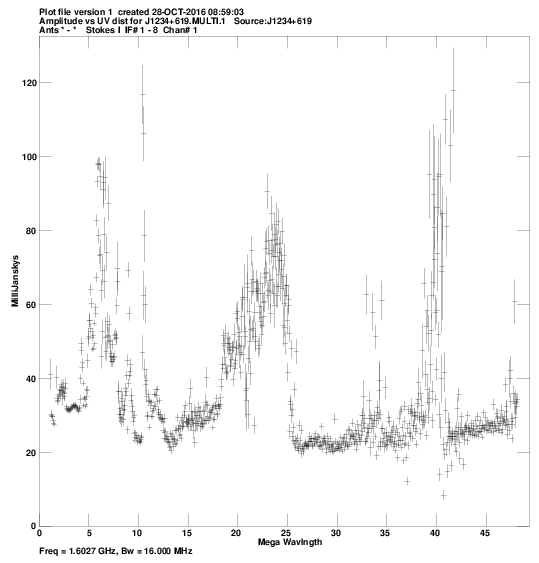
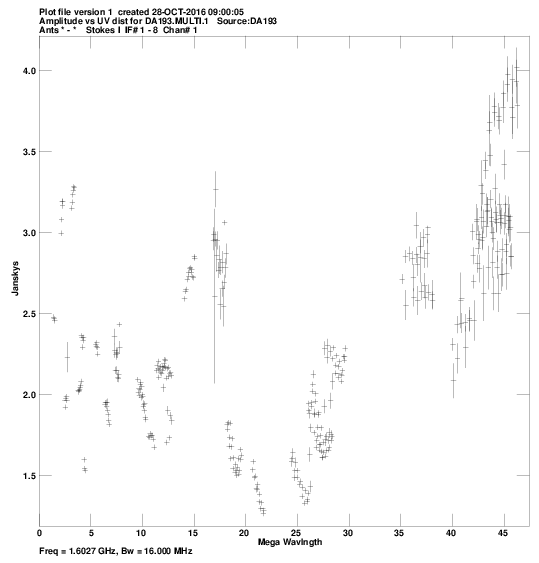
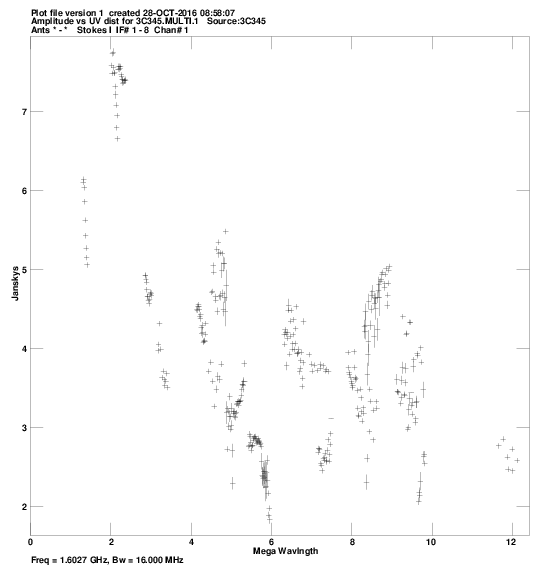
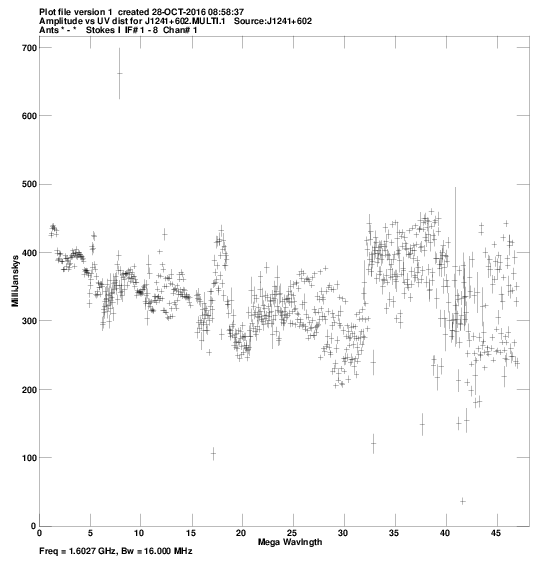
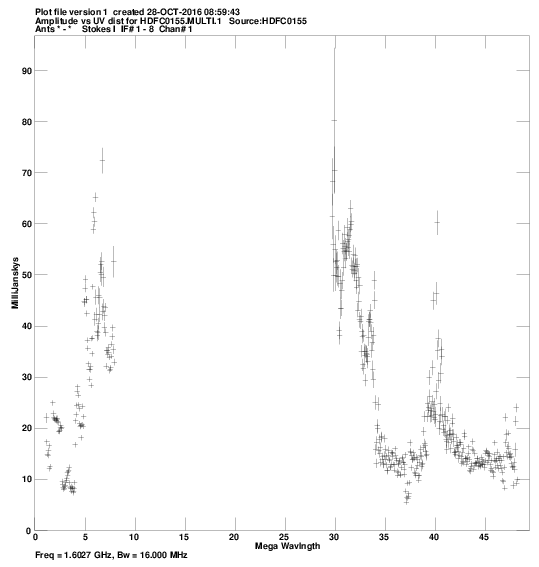
Calibrated visibilities against u,v distance for:
J1234+619:
pdf
, or
png
.
DA193:
pdf
, or
png
.
3C345:
pdf
, or
png
.
J1241+602:
pdf
, or
png
.
HDFC0155:
pdf
, or
png
.
Comments.
For each source, a plot of amp vs. |uv| distance. J1234 has excess FD around 20-25 Mlamdba (as in the previous parts). Overall, editing the ANTAB file greatly reduced the amount of extremely high outliers in the amp(|uv|) plots; here, flagging Bd removed the last few of these; here, flagging Bd removed the last few of these; here, flagging Bd removed the last few of these; here, flagging Bd removed the last few of these.
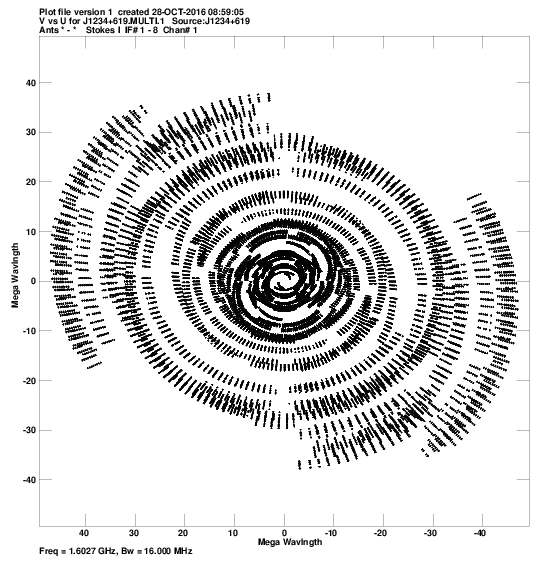
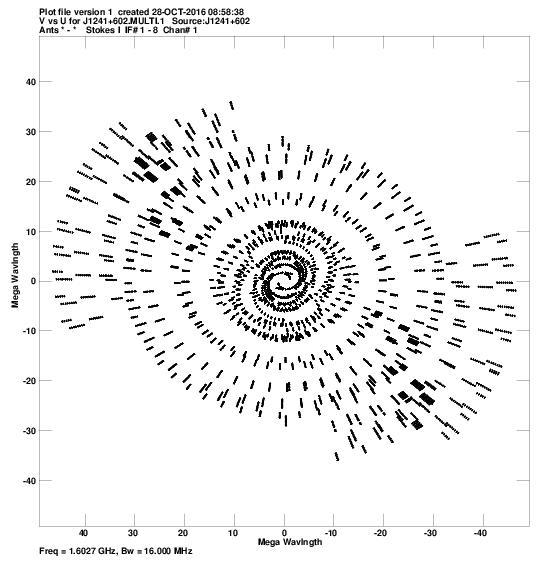
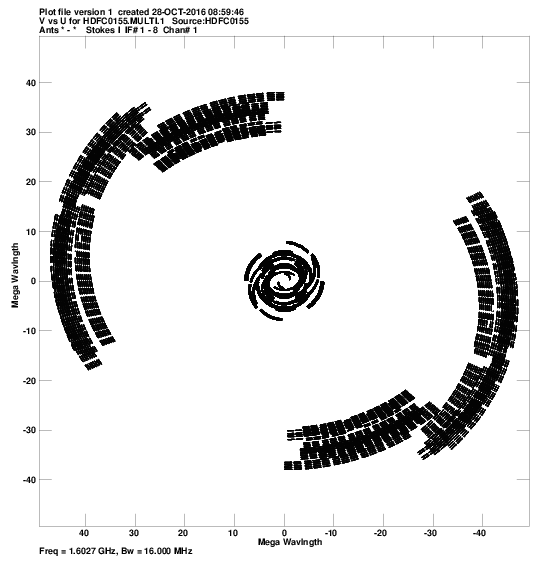
u,v coverage for:
J1234+619:
pdf
, or
png
.
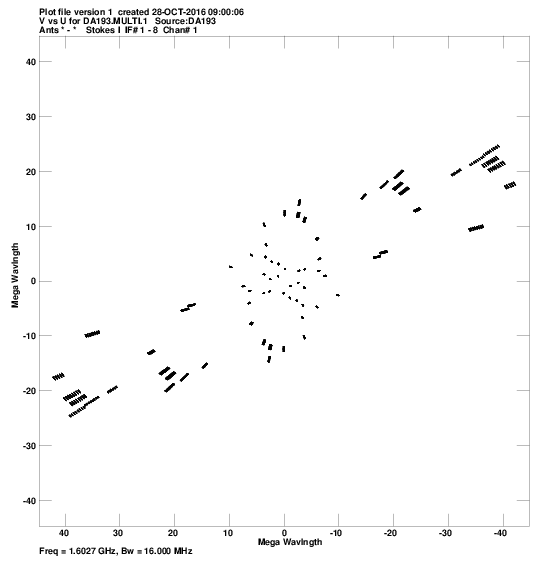
DA193:
pdf
, or
png
.
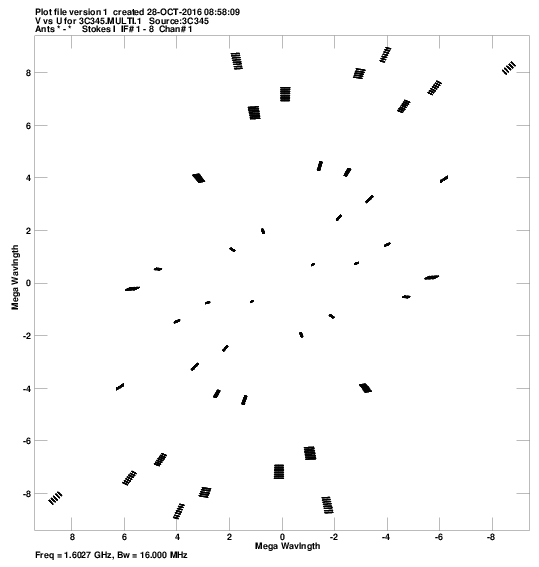
3C345:
pdf
, or
png
.
J1241+602:
pdf
, or
png
.
HDFC0155:
pdf
, or
png
.
Comments.
For each source, a plot of the u-v coverage.
Crude maps of sources:
J1234+619:
pdf
, or
FITS
.
DA193:
pdf
, or
FITS
.
3C345:
pdf
, or
FITS
.
J1241+602:
pdf
, or
FITS
.
HDFC0155:
pdf
, or
FITS
.
Comments.
For each source, a CLEAN map resulting from the automated fringing and self-cal iterations (or phase-referencing) in the pipeline script.