
EVN User Experiment Pipeline Feedback
Last updated: Mon Oct 11 15:51:54 CEST 2010
yang@jive.nl
General Comments.
(
Brief data summary
and
scan listing
)
EM071B had 9 stations and 2 correlator passes. This pipelining specifically relates to the continuum pass, using 8 2MHz IFs, 2 polarizations, and 128 frequency points per IF/pol. More information is included in the experiment's cover letter on the standard-plots portion of the EVN Archive. The SOLINT was set automatically to a representative reference-source scan length (about 3min by inspection). In the pipelining, the target was treated as a phase-referenced source and not directly fringed. Ef was used as the reference station.
The EVN reliability indicator (ERI) for this experiment was
ERI = 0.75 . ERI* = 0.75 .
(Cm=0, Ef=0.95, Wb=1, Jb=0.92, On=1, Mc=1, Nt=1, Tr=1, Ys=1).
Plots of the autocorrelations
Comments.
Each scan plotted separately, all stations. Wb: The unusual bandpass is a benign feature of its digital backend TADUmax.
plots of the uncalibrated amplitude and phase
against time
Comments.
Full-experiment for Ef-* baselines, no calibration applied. Nt: noisy fringes as it used Rb maser due to problems with H maser.
Plots of the uncalibrated amplitude and phase
against frequency channel
Comments.
Scalar averaged Ef-* baselines, each scan plotted separately. No calibration applied yet. The lines are clearly detected.
The uncalibrated amplitude and phase of the crosshand
correlations against frequency channel
(not available)
Comments.
TSYS against time
Comments.
TY1 table, each IF/pol on a separate plot.
Telescope sensitivities
from the a priori TSYS and Gain
curves (the square of this number gives the antenna noise (SEFD) in Jy - the
smaller the better).
Comments.
Gain amplitude from CL2 table.
Fringe-fit phase solutions
(including Parallactic
Angle correction).
Comments.
CL3 station phase solutions -- CL3 = CL2+SN2, thus also includes the initial amplitude/parallactic angle calibration from CL2 and the fringe solutions from SN2. Nt: Fast fringe rotation as poor stability of Rb maser.
Fringe-fit delay solutions
Comments.
SN2 station delay solutions for the fringed sources, each IF/pol on a separate plot. Nt: Used Rb maser due to problems with H-maser.
Fringe-fit rate solutions
Comments.
SN2 station rate solutions.
Telescope bandpasses
Comments.
Bandpass table 1. J1751+0939 and J2253+1608 were used for bandpass calibration.
Calibrated amplitude and phase against time
(a
priori amplitude calibration and fringe-fit solutions applied).
Comments.
Full-experiment for Ef-* baselines, calibrated with CL3. The 1.5-min plot-averaging still applied.
Calibrated amplitude and phase against frequency
channel
Comments.
Ef-* baselines calibrated with CL3 and BP1. The amp and phase plots self-scale, not necessarily going down to 0 in the case of the amps.
Naturally weighted dirty map (not useful for bright sources)
produced before self-cal of:
J1751+0939: pdf (not available)
, or
FITS (not available)
.
J2253+1608: pdf (not available)
, or
FITS (not available)
.
J1834-0301: pdf (not available)
, or
FITS (not available)
.
G31.41:
pdf
, or
FITS
.
Comments.
Naturually weighted dirty map of the target.
Uniformly weighted dirty map (not useful for bright sources)
produced before self-cal of:
J1751+0939: pdf (not available)
, or
FITS (not available)
.
J2253+1608: pdf (not available)
, or
FITS (not available)
.
J1834-0301: pdf (not available)
, or
FITS (not available)
.
G31.41:
pdf
, or
FITS
.
Comments.
Uniformly weighted dirty map of the target.
Phase corrections applied to a priori calibrated and
fringe-fitted data by self-calibration.
J1751+0939
.
J2253+1608
.
J1834-0301
.
G31.41 (not available)
.
Comments.
Plots of post-SPLIT tables SN1 for the sources.
Amplitude corrections applied to a priori calibrated and
fringe-fitted data by self-calibration.
J1751+0939:
pdf
, or
text file
, or
statistical summary
.
J2253+1608:
pdf
, or
text file
, or
statistical summary
.
J1834-0301:
pdf
, or
text file
, or
statistical summary
.
G31.41: pdf (not available)
, or
text file (not available)
, or
statistical summary (not available)
.
Comments.
As above, but for the post-SPLIT table SN2.
Telescope sensitivities
(the total AMP gain applied
during both a priori and self calibration; the square of this number gives the
antenna noise (SEFD) in Jy).
Comments.
CL4 gain-amp.
Residual closure phase (visibility closure phase with model closure phase subtracted) for:
J1751+0939
.
J2253+1608
.
J1834-0301
.
G31.41 (not available)
.
Comments.
Separate files per (fringed) source, showing closure phase plots for all the triangles (not just Ef-*-*). Only stokes=I shown.
Calibrated visibilities and the source model of:
J1751+0939
.
J2253+1608
.
J1834-0301
.
G31.41
.
Comments.
For each (fringed) source, plots of amp/phase on Ef-* baselines, calibrated with (post-SPLIT) table CL3, with a model-line overplotted.
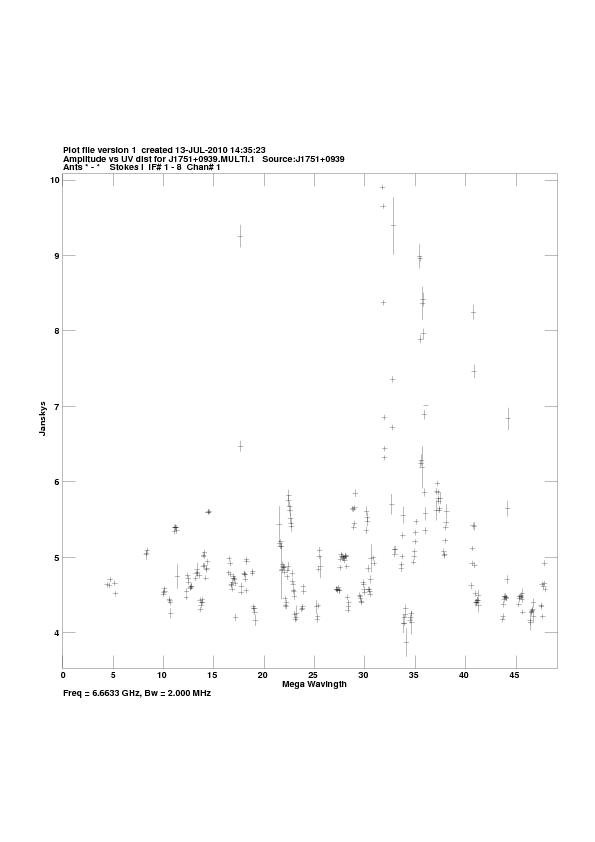
Calibrated visibilities against u,v distance for:
J1751+0939:
pdf
, or
png
.
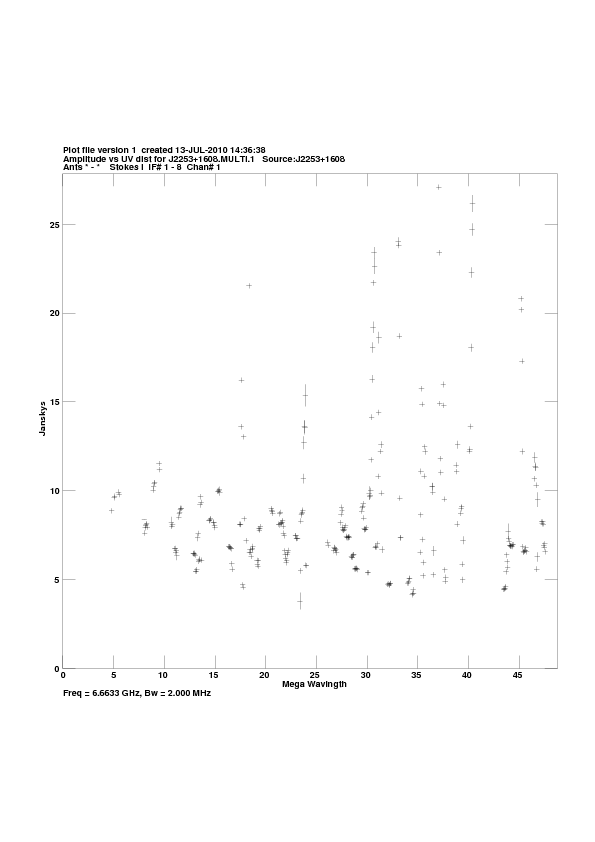
J2253+1608:
pdf
, or
png
.
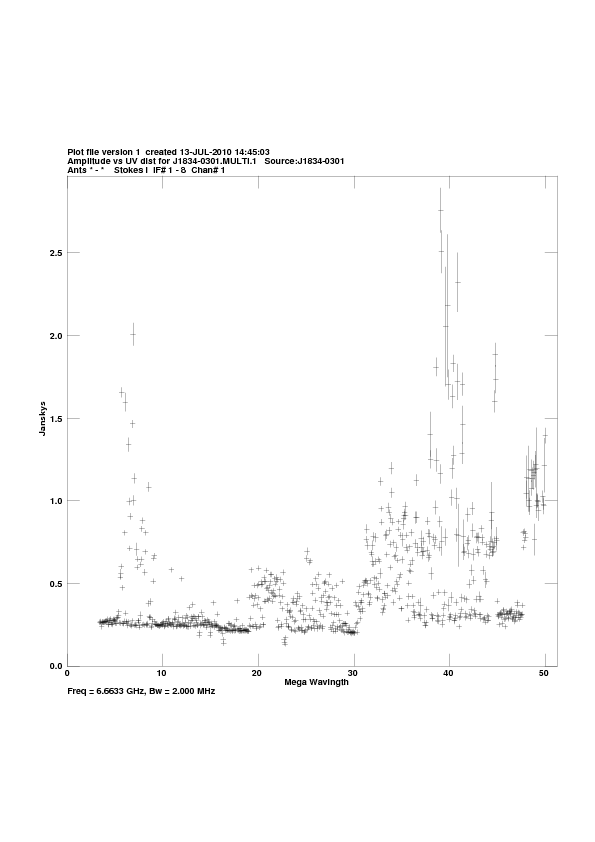
J1834-0301:
pdf
, or
png
.
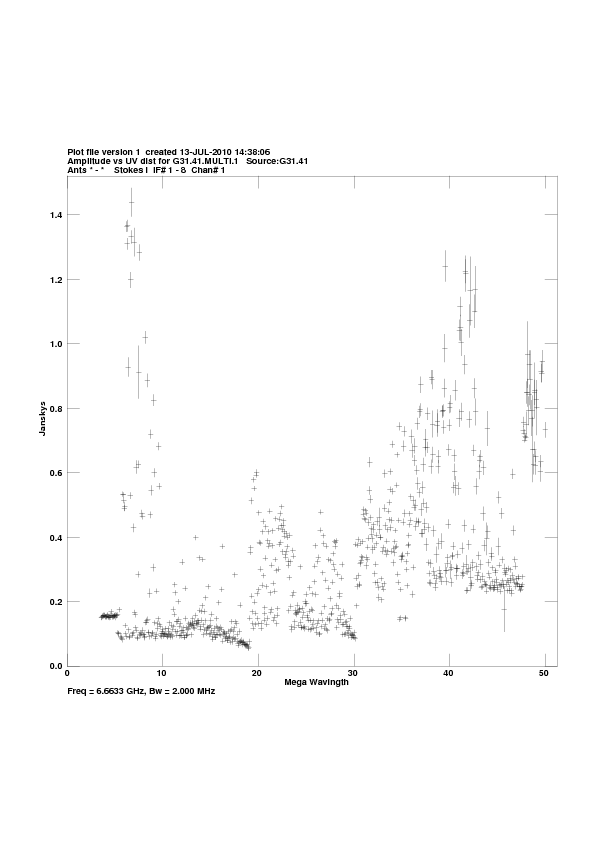
G31.41:
pdf
, or
png
.
Comments.
For each source, a plot of amp vs. |uv| distance.
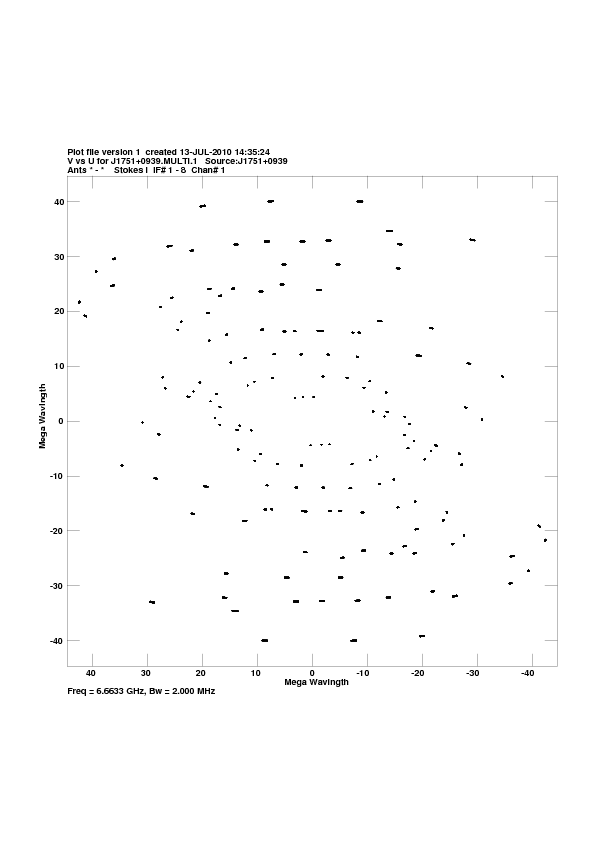
u,v coverage for:
J1751+0939:
pdf
, or
png
.
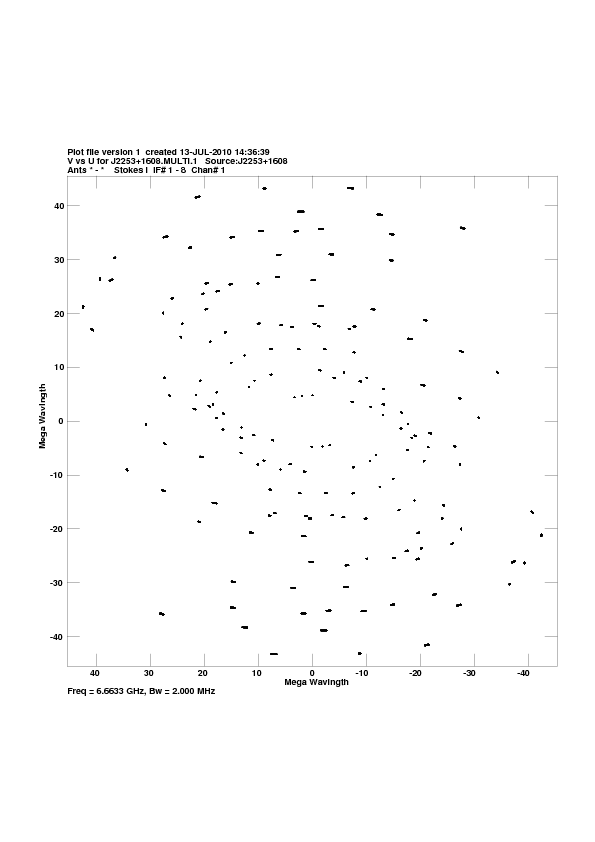
J2253+1608:
pdf
, or
png
.
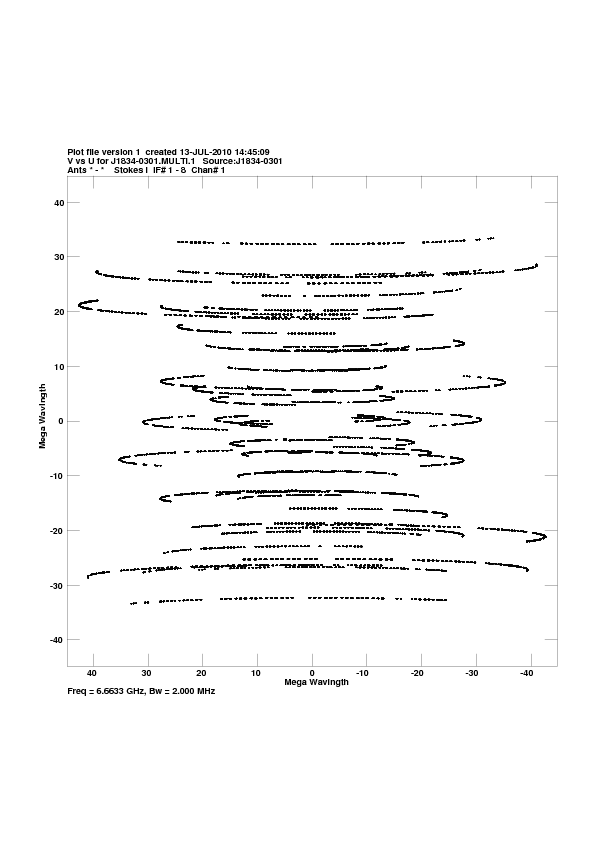
J1834-0301:
pdf
, or
png
.
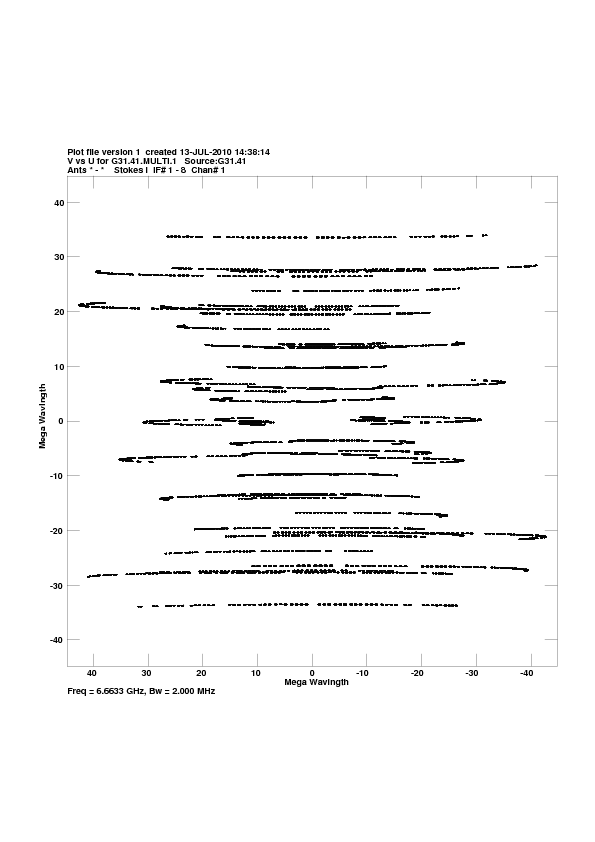
G31.41:
pdf
, or
png
.
Comments.
For each source, a plot of the u-v coverage.
Crude maps of sources:
J1751+0939:
pdf
, or
FITS
.
J2253+1608:
pdf
, or
FITS
.
J1834-0301:
pdf
, or
FITS
.
G31.41:
pdf
, or
FITS
.
Comments.
For each source, a CLEAN map resulting from the automated fringing and self-cal iterations (or phase-referencing) in the pipeline script.