
EVN User Experiment Pipeline Feedback
Last updated: Sat Apr 16 11:43:50 CEST 2016
mao@jive.eu
General Comments.
(
Brief data summary
and
scan listing
)
C-band e-VLBI observed on 06 June 2015. 10 stations scheduled, 8 observed. Participating telescopes were Hartebeesthoek, Jodrell Bank (Mk2), Medicina, Noto, Onsala (25m), Sheshan (25m), Torun, Westerbork (single dish).
JB antab from the log file. NT antab is nominal from EC054B.
The EVN reliability indicator (ERI) for this experiment was
ERI = 0.62 . ERI* = 0.62 .
The ERI* value takes into account that:
-EF and YB didn't observe. Effelsberg had a problem with the subreflector and Yebes with the azimuth drive.
Note that only EVN stations contribute to the ERI statistics.
The ERI value also takes into account losses that are outside the station's control, of which there were none for this experiment.
Plots of the autocorrelations
Comments.
Each scan plotted separately, all stations.
Plots of the uncalibrated amplitude and phase
against time
Comments.
Full-experiment for Tr-* baselines, no calibration applied. A 1.5-minute plot-averaging was used.
Plots of the uncalibrated amplitude and phase
against frequency channel
Comments.
Scalar averaged Tr-* baselines, each scan plotted separately. No calibration applied yet.
The uncalibrated amplitude and phase of the crosshand
correlations against frequency channel
Comments.
Scalar averaged Tr-* baselines showing LR, each scan plotted separately. No calibration applied yet. As noted in the cover letter, Wb IF2 had issues.
TSYS against time
Comments.
TY1 table, each IF/pol on a separate plot. The ANTAB information for the VLBA stations was derived from the 80-Hz continuous-cal system as read from its effect on the stations' sampler statistics during correlation.
Telescope sensitivities
from the a priori TSYS and Gain
curves (the square of this number gives the antenna noise (SEFD) in Jy - the
smaller the better).
Comments.
Gain amplitude from CL2 table.
Fringe-fit phase solutions
(including Parallactic
Angle correction).
Comments.
CL3 station phase solutions -- CL3 = CL2+SN2, thus also includes the initial amplitude/parallactic angle calibration from CL2 and the fringe solutions from SN2.
Fringe-fit delay solutions
Comments.
SN2 station delay solutions for the fringed sources, each IF/pol on a separate plot.
Fringe-fit rate solutions
Comments.
SN2 station rate solutions.
Telescope bandpasses
Comments.
Bandpass table 1. 3C345, NRAO512 used for bandpass calibration.
Calibrated amplitude and phase against time
(a
priori amplitude calibration and fringe-fit solutions applied).
Comments.
Full-experiment for Tr-* baselines, calibrated with CL3. A 1.5-min plot-averaging was used.
Calibrated amplitude and phase against frequency
channel
Comments.
Tr-* baselines calibrated with CL3 and BP1. The amp and phase plots self-scale, not necessarily going down to 0 in the case of the amps.
Naturally weighted dirty map (not useful for bright sources)
produced before self-cal of:
J1649+2635:
pdf
, or
FITS
.
J1642+2523: pdf (not available)
, or
FITS (not available)
.
NRAO512: pdf (not available)
, or
FITS (not available)
.
3C345: pdf (not available)
, or
FITS (not available)
.
Comments.
Naturally-weighted dirty maps of the phase-referenced-to sources.
Uniformly weighted dirty map (not useful for bright sources)
produced before self-cal of:
J1649+2635:
pdf
, or
FITS
.
J1642+2523: pdf (not available)
, or
FITS (not available)
.
NRAO512: pdf (not available)
, or
FITS (not available)
.
3C345: pdf (not available)
, or
FITS (not available)
.
Comments.
Uniformly-weighted dirty maps of the phase-referenced-to sources.
Phase corrections applied to a priori calibrated and
fringe-fitted data by self-calibration.
J1649+2635 (not available)
.
J1642+2523
.
NRAO512
.
3C345
.
Comments.
Plots of post-SPLIT tables SN1 for the sources that have been individually fringed.
Amplitude corrections applied to a priori calibrated and
fringe-fitted data by self-calibration.
J1649+2635: pdf (not available)
, or
text file (not available)
, or
statistical summary (not available)
.
J1642+2523:
pdf
, or
text file
, or
statistical summary
.
NRAO512:
pdf
, or
text file
, or
statistical summary
.
3C345:
pdf
, or
text file
, or
statistical summary
.
Comments.
As above, but for the post-SPLIT table SN2.
Telescope sensitivities
(the total AMP gain applied
during both a priori and self calibration; the square of this number gives the
antenna noise (SEFD) in Jy).
Comments.
CL4 gain-amp.
Residual closure phase (visibility closure phase with model closure phase subtracted) for:
J1649+2635 (not available)
.
J1642+2523
.
NRAO512
.
3C345
.
Comments.
Separate files per (fringed) source, showing closure phase plots for all the triangles. Only stokes=I shown.
Calibrated visibilities and the source model of:
J1649+2635 (not available)
.
J1642+2523
.
NRAO512
.
3C345
.
Comments.
For each (fringed) source, plots of amp/phase on Tr-* baselines, calibrated with (post-SPLIT) table CL3, with a model-line overplotted.
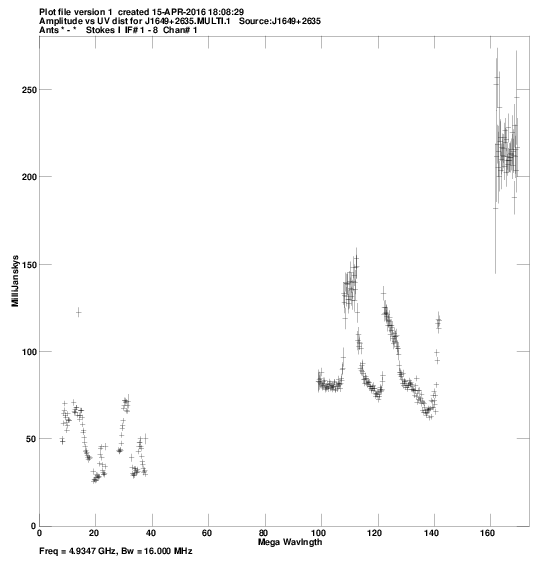
Calibrated visibilities against u,v distance for:
J1649+2635:
pdf
, or
png
.
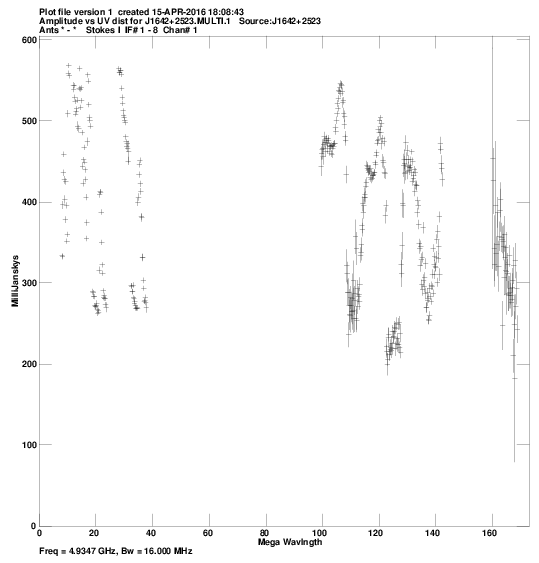
J1642+2523:
pdf
, or
png
.
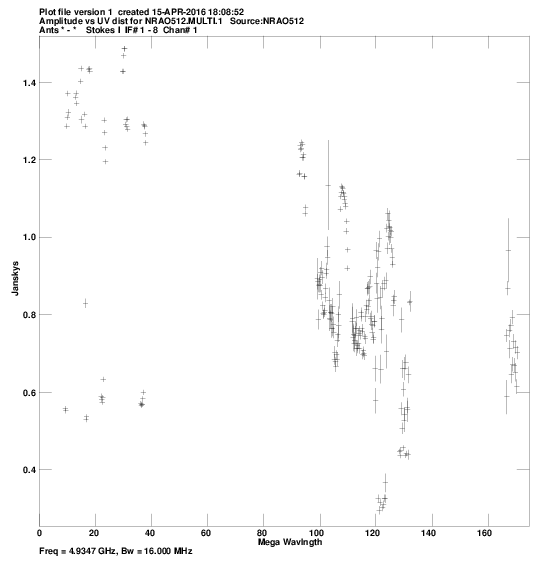
NRAO512:
pdf
, or
png
.
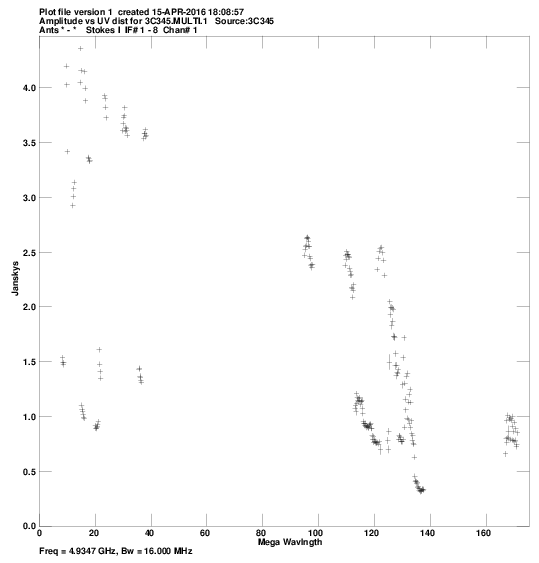
3C345:
pdf
, or
png
.
Comments.
For each source, a plot of amp vs. |uv| distance.
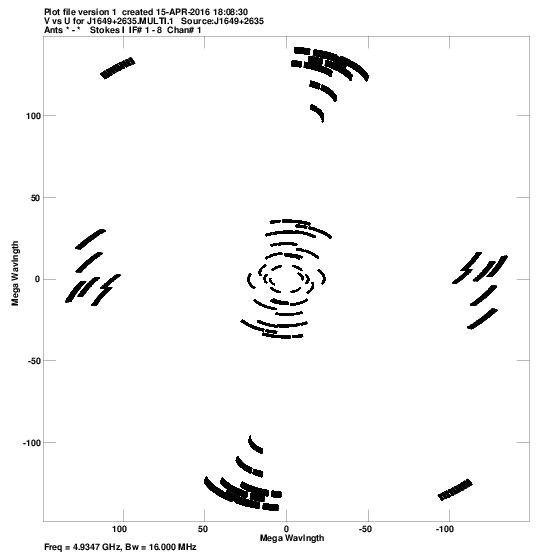
u,v coverage for:
J1649+2635:
pdf
, or
png
.
J1642+2523:
pdf
, or
png
.
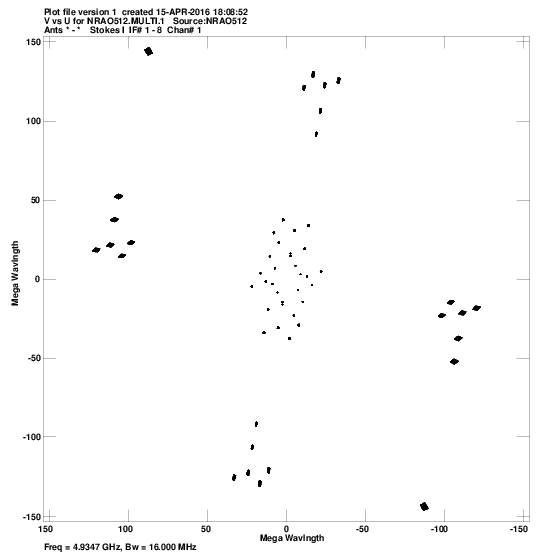
NRAO512:
pdf
, or
png
.
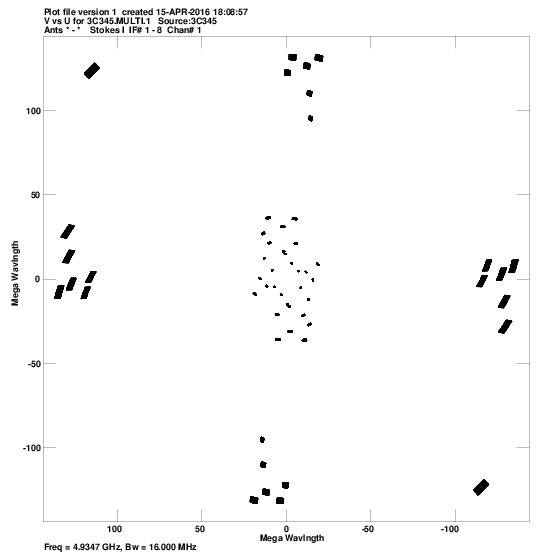
3C345:
pdf
, or
png
.
Comments.
For each source, a plot of the u-v coverage.
Crude maps of sources:
J1649+2635:
pdf
, or
FITS
.
J1642+2523:
pdf
, or
FITS
.
NRAO512:
pdf
, or
FITS
.
3C345:
pdf
, or
FITS
.
Comments.
For each source, a CLEAN map resulting from the automated fringing and self-cal iterations (or phase-referencing) in the pipeline script. The target is clearly detected.