
EVN User Experiment Pipeline Feedback
Last updated: Tue Mar 25 16:26:59 CET 2014
campbell@jive.nl
General Comments.
(
Brief data summary
and
scan listing
)
EP087F had 9 good stations, 8 16MHz IFs, 4 polarizations, 32 frequency points per IF/pol, and 1s integrations. Considerably more information is included in the experiment's cover letter on the standard-plots portion of the EVN Archive. This pipelining corresponds to the multiple phase-center output target ARP299A. In the pipelining, the target sources were treated as phase-reference targets and were not separately fringe-fit. The SOLINT was set automatically to a value commensurate with a typical reference-source scan. Ef was used as the reference station.
The EVN reliability indicator (ERI) for this experiment was
ERI = 0.455 . ERI* = 0.455 .
The losses include Ur and Nt being completely lost, Sv missing the LCP channels, and Sh having fringes only in IF1/R.
Plots of the autocorrelations
Comments.
Each scan plotted separately, all stations.
plots of the uncalibrated amplitude and phase
against time
Comments.
Full-experiment for Ef-* baselines, no calibration applied. A 1.75 minute plot-averaging was used.
Plots of the uncalibrated amplitude and phase
against frequency channel
Comments.
Scalar averaged Ef-* baselines, each scan plotted separately. No calibration applied yet.
The uncalibrated amplitude and phase of the crosshand
correlations against frequency channel
Comments.
Scalar averaged Ef-* baselines showing LR, each scan plotted separately. No calibration applied yet.
TSYS against time
Comments.
TY1 table, each IF/pol on a separate plot.
Telescope sensitivities
from the a priori TSYS and Gain
curves (the square of this number gives the antenna noise (SEFD) in Jy - the
smaller the better).
Comments.
Gain amplitude from CL2 table.
Fringe-fit phase solutions
(including Parallactic
Angle correction).
Comments.
CL3 station phase solutions -- CL3 = CL2+SN2, thus also includes the initial amplitude/parallactic angle calibration from CL2 and the fringe solutions from SN2.
Fringe-fit delay solutions
Comments.
SN2 station delay solutions for the fringed sources, each IF/pol on a separate plot.
Fringe-fit rate solutions
Comments.
SN2 station rate solutions. Ys had a fair amount of scatter in the rate solutions, leading to some clear instances of phas-connection problems in the FRING_PHAS plot.
Telescope bandpasses
Comments.
Bandpass table 1. 4C39.25 was used for bandpass calibration.
Calibrated amplitude and phase against time
(a
priori amplitude calibration and fringe-fit solutions applied).
Comments.
Full-experiment for Ef-* baselines, calibrated with CL3. The 1.75-min plot-averaging still applied.
Calibrated amplitude and phase against frequency
channel
Comments.
Ef-* baselines calibrated with CL3 and BP1. The amp and phase plots self-scale, not necessarily going down to 0 in the case of the amps.
Naturally weighted dirty map (not useful for bright sources)
produced before self-cal of:
J1128+5925: pdf (not available)
, or
FITS (not available)
.
ARP299A:
pdf
, or
FITS
.
4C39.25: pdf (not available)
, or
FITS (not available)
.
Comments.
Naturally-weighted dirty maps of the phase-referenced-to sources.
Uniformly weighted dirty map (not useful for bright sources)
produced before self-cal of:
J1128+5925: pdf (not available)
, or
FITS (not available)
.
ARP299A:
pdf
, or
FITS
.
4C39.25: pdf (not available)
, or
FITS (not available)
.
Comments.
Uniformly-weighted dirty maps of the phase-referenced-to sources.
Phase corrections applied to a priori calibrated and
fringe-fitted data by self-calibration.
J1128+5925
.
ARP299A (not available)
.
4C39.25
.
Comments.
Plots of post-SPLIT tables SN1 for the sources that have been individually fringed.
Amplitude corrections applied to a priori calibrated and
fringe-fitted data by self-calibration.
J1128+5925:
pdf
, or
text file
, or
statistical summary
.
ARP299A: pdf (not available)
, or
text file (not available)
, or
statistical summary (not available)
.
4C39.25:
pdf
, or
text file
, or
statistical summary
.
Comments.
As above, but for the post-SPLIT table SN2.
Telescope sensitivities
(the total AMP gain applied
during both a priori and self calibration; the square of this number gives the
antenna noise (SEFD) in Jy).
Comments.
CL4 gain-amp.
Residual closure phase (visibility closure phase with model closure phase subtracted) for:
J1128+5925
.
ARP299A (not available)
.
4C39.25
.
Comments.
Separate files per (fringed) source, showing closure phase plots for all the triangles. Only stokes=I shown.
Calibrated visibilities and the source model of:
J1128+5925
.
ARP299A (not available)
.
4C39.25
.
Comments.
For each (fringed) source, plots of amp/phase on Ef-* baselines, calibrated with (post-SPLIT) table CL3, with a model-line overplotted.
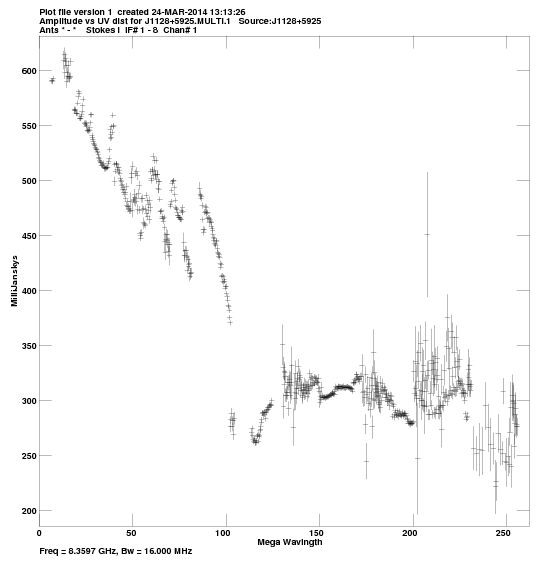
Calibrated visibilities against u,v distance for:
J1128+5925:
pdf
, or
png
.
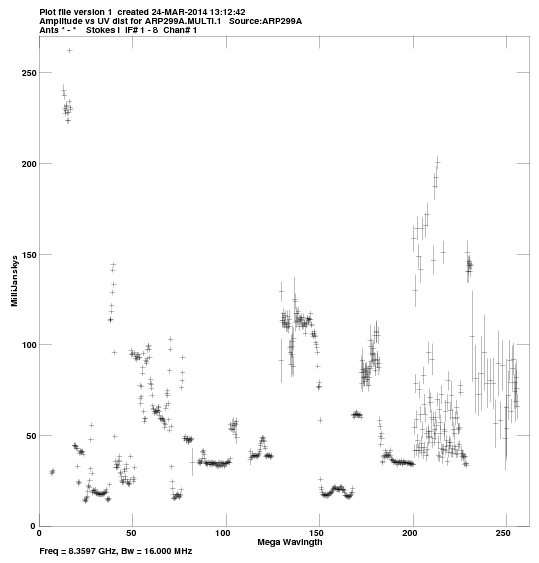
ARP299A:
pdf
, or
png
.
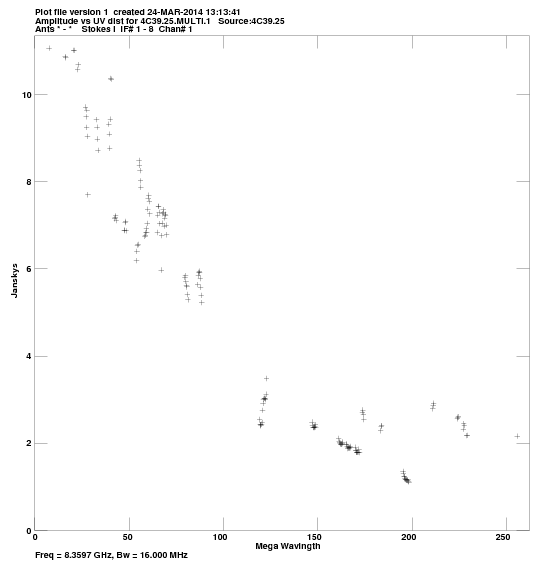
4C39.25:
pdf
, or
png
.
Comments.
For each source, a plot of amp vs. |uv| distance.
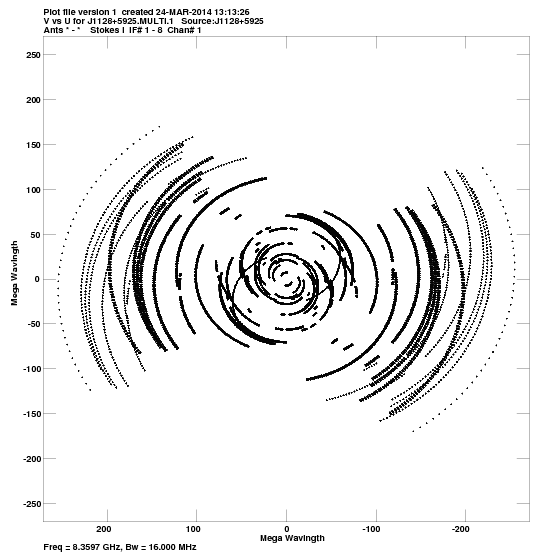
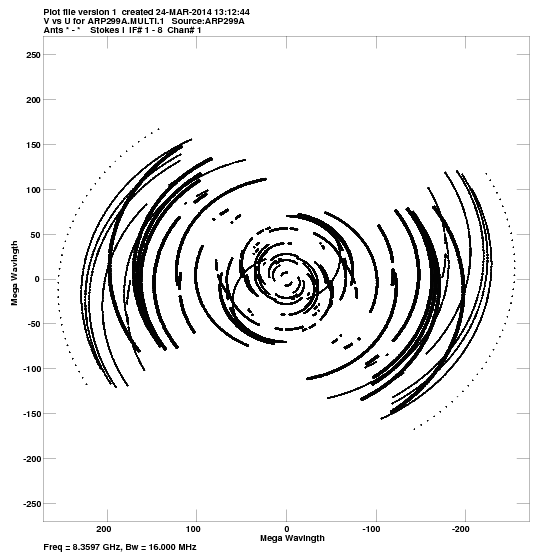
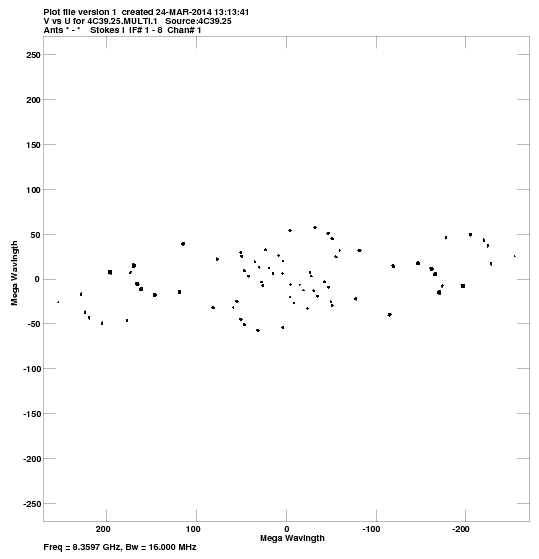
u,v coverage for:
J1128+5925:
pdf
, or
png
.
ARP299A:
pdf
, or
png
.
4C39.25:
pdf
, or
png
.
Comments.
For each source, a plot of the u-v coverage.
Crude maps of sources:
J1128+5925:
pdf
, or
FITS
.
ARP299A:
pdf
, or
FITS
.
4C39.25:
pdf
, or
FITS
.
Comments.
For each source, a CLEAN map resulting from the automated fringing and self-cal iterations (or phase-referencing) in the pipeline script.