
EVN User Experiment Pipeline Feedback
Last updated: Mon Dec 7 18:22:07 CET 2015
mao@jive.eu
General Comments.
(
Brief data summary
and
scan listing
)
C-band phase-referencing experiment, observed on 09 June 2015. ER043B contains 8 x 8MHz bands and 4 x polarisations, each with 32 frequency points. The target sources, IRAS15250 and IRAS10565, were calibrated using the phase-reference sources J1522+3144 and J1102+2757. 4C39.25 was the fringe finder.
14 stations scheduled.
The EVN reliability indicator (ERI) for this experiment was
ERI = 0.86 . ERI* = 0.86 .
The ERI* value takes into account that:
- TR has no fringes.
The ERI value also takes into account losses that are outside the station's control, of which there were none for this experiment.
Plots of the autocorrelations
Comments.
Each scan plotted separately, all stations. Some RFI spikes.
plots of the uncalibrated amplitude and phase
against time
Comments.
Full-experiment for Ef-* baselines, no calibration applied. A 1.5 minute plot-averaging was used.
Plots of the uncalibrated amplitude and phase
against frequency channel
Comments.
Scalar averaged Ef-* baselines, each scan plotted separately. No calibration applied yet. Fringes seen to all antennas. Note that SV is weak for the first scan. Baselines to MC show a slope of increasing amp with frequency.
The uncalibrated amplitude and phase of the crosshand
correlations against frequency channel
Comments.
Scalar averaged Ef-* baselines for LR, each scan plotted separately. No calibration applied yet.
TSYS against time
Comments.
TY1 table, each IF/pol on a separate plot. Note that the TSYS values for YS may be ~2x too low?
Telescope sensitivities
from the a priori TSYS and Gain
curves (the square of this number gives the antenna noise (SEFD) in Jy - the
smaller the better).
Comments.
Gain amplitude from CL2 table.
Fringe-fit phase solutions
(including Parallactic
Angle correction).
Comments.
CL3 station phase solutions -- CL3 = CL2+SN2, thus also includes the initial amplitude/parallactic angle calibration from CL2 and the fringe solutions from SN2. Note that some scans failed for JB (LCP), SV and BD. Take care when re-FRINGing your data.
Fringe-fit delay solutions
Comments.
SN2 station delay solutions for the fringed sources, each IF/pol on a separate plot. Note that some scans failed for JB (LCP), SV and BD. Take care when re-FRINGing your data.
Fringe-fit rate solutions
Comments.
SN2 station rate solutions. Note that some scans failed for JB (LCP), SV and BD. Take care when re-FRINGing your data.
Telescope bandpasses
Comments.
Bandpass table 1. J1102+2757 used for bandpass calibration.
Calibrated amplitude and phase against time
(a
priori amplitude calibration and fringe-fit solutions applied).
Comments.
Full-experiment for Ef-* baselines, calibrated with CL3. A 1.5 minute plot-averaging was used.
Calibrated amplitude and phase against frequency
channel
Comments.
Ef-* baselines calibrated with CL3 and BP1. The amp and phase plots self-scale, not necessarily going down to 0 in the case of the amps.
Naturally weighted dirty map (not useful for bright sources)
produced before self-cal of:
4C39.25: pdf (not available)
, or
FITS (not available)
.
IRAS10565:
pdf
, or
FITS
.
J1522+3144: pdf (not available)
, or
FITS (not available)
.
J1102+2757: pdf (not available)
, or
FITS (not available)
.
IRAS15250:
pdf
, or
FITS
.
Comments.
Naturally weighted dirty maps of phase-referenced sources.
Uniformly weighted dirty map (not useful for bright sources)
produced before self-cal of:
4C39.25: pdf (not available)
, or
FITS (not available)
.
IRAS10565:
pdf
, or
FITS
.
J1522+3144: pdf (not available)
, or
FITS (not available)
.
J1102+2757: pdf (not available)
, or
FITS (not available)
.
IRAS15250:
pdf
, or
FITS
.
Comments.
Uniformly weighted dirty maps of phase-referenced sources.
Phase corrections applied to a priori calibrated and
fringe-fitted data by self-calibration.
4C39.25
.
IRAS10565 (not available)
.
J1522+3144
.
J1102+2757
.
IRAS15250 (not available)
.
Comments.
Plots of post-SPLIT tables SN1 for the sources that have been individually fringed.
Amplitude corrections applied to a priori calibrated and
fringe-fitted data by self-calibration.
4C39.25:
pdf
, or
text file
, or
statistical summary
.
IRAS10565: pdf (not available)
, or
text file (not available)
, or
statistical summary (not available)
.
J1522+3144:
pdf
, or
text file
, or
statistical summary
.
J1102+2757:
pdf
, or
text file
, or
statistical summary
.
IRAS15250: pdf (not available)
, or
text file (not available)
, or
statistical summary (not available)
.
Comments.
As above, but for the post-SPLIT table SN2.
Telescope sensitivities
(the total AMP gain applied
during both a priori and self calibration; the square of this number gives the
antenna noise (SEFD) in Jy).
Comments.
CL4 gain-amp.
Residual closure phase (visibility closure phase with model closure phase subtracted) for:
4C39.25
.
IRAS10565 (not available)
.
J1522+3144
.
J1102+2757
.
IRAS15250 (not available)
.
Comments.
Separate files per (fringed) source, showing closure phase plots for all the triangles. Only stokes=I shown.
Calibrated visibilities and the source model of:
4C39.25
.
IRAS10565 (not available)
.
J1522+3144
.
J1102+2757
.
IRAS15250 (not available)
.
Comments.
For each (fringed) source, plots of amp/phase on Ef-* baselines, calibrated with (post-SPLIT) table CL3, with a model-line overplotted.
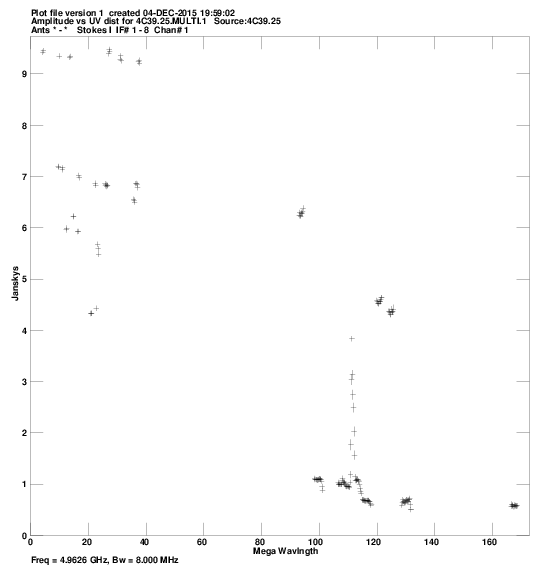
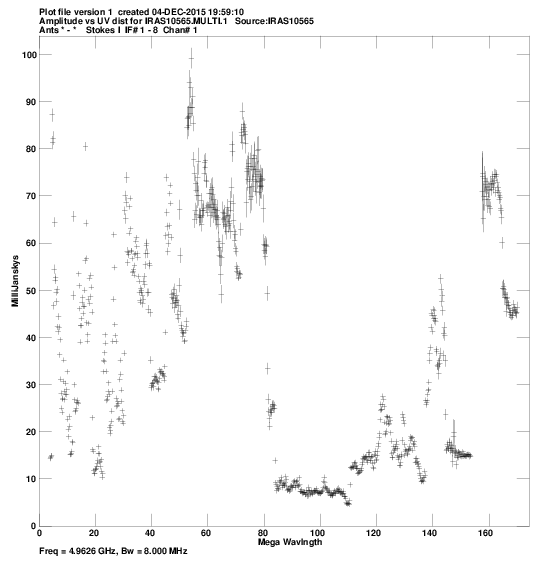
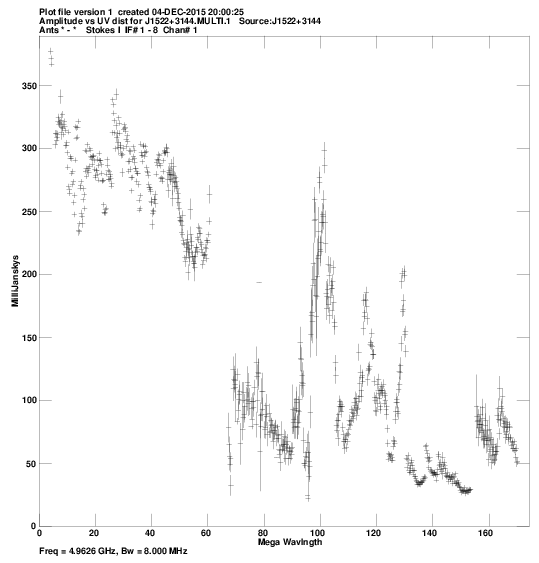
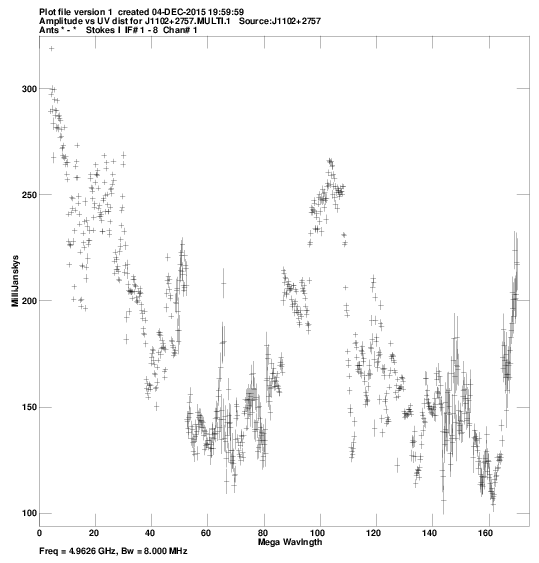
Calibrated visibilities against u,v distance for:
4C39.25:
pdf
, or
png
.
IRAS10565:
pdf
, or
png
.
J1522+3144:
pdf
, or
png
.
J1102+2757:
pdf
, or
png
.
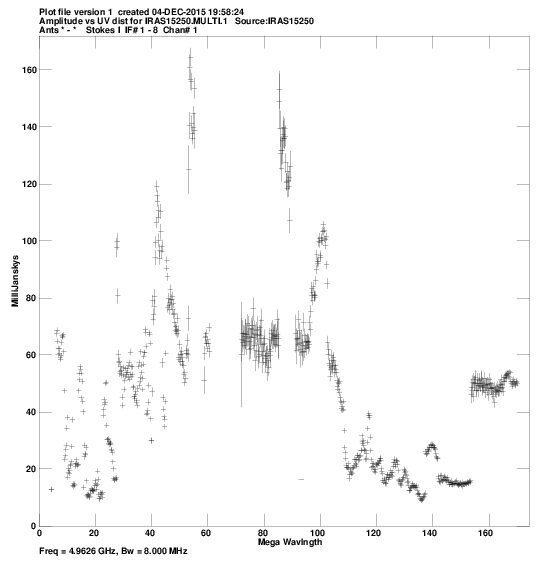
IRAS15250:
pdf
, or
png
.
Comments.
For each source, a plot of amp vs. |uv| distance.
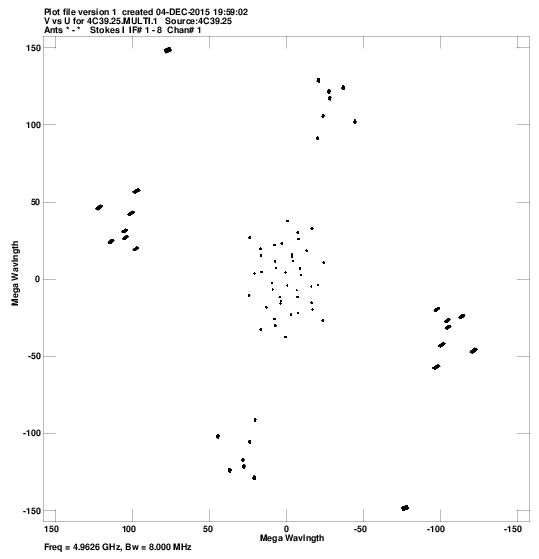
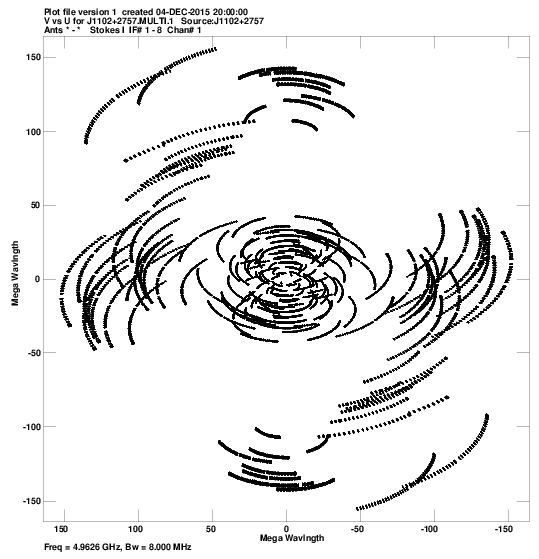
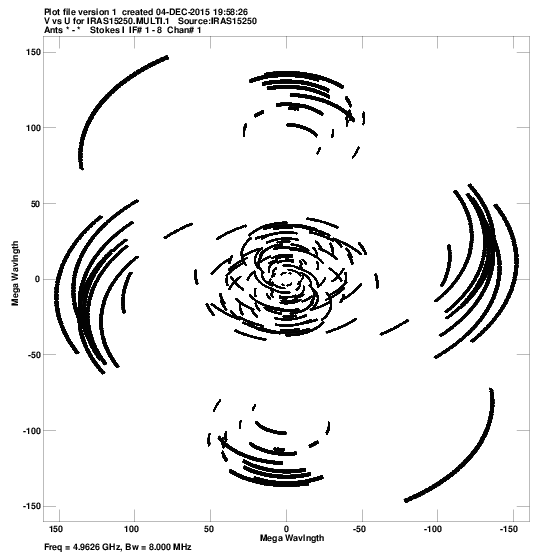
u,v coverage for:
4C39.25:
pdf
, or
png
.
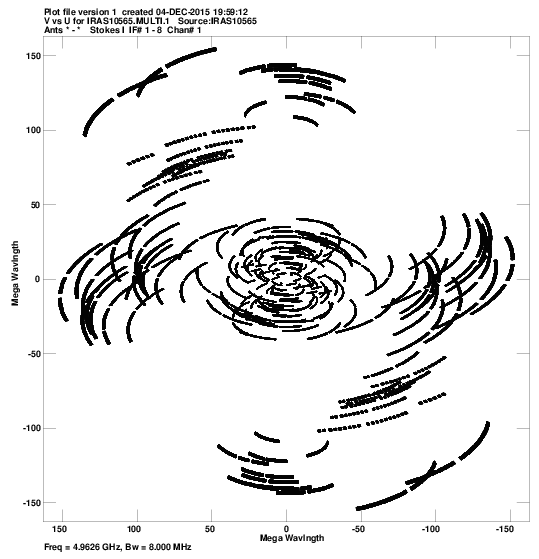
IRAS10565:
pdf
, or
png
.
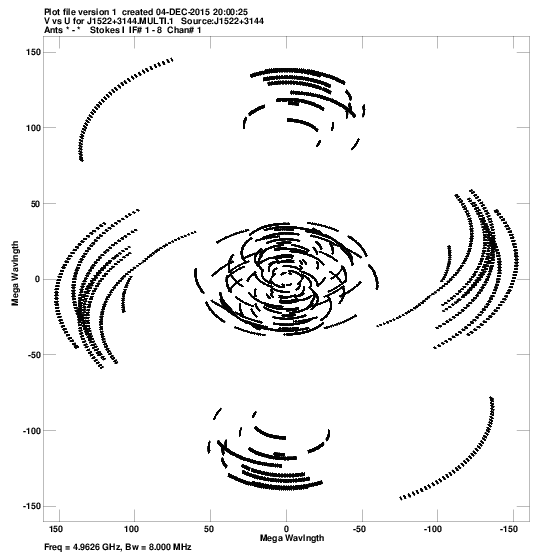
J1522+3144:
pdf
, or
png
.
J1102+2757:
pdf
, or
png
.
IRAS15250:
pdf
, or
png
.
Comments.
For each source, a plot of the u-v coverage.
Crude maps of sources:
4C39.25:
pdf
, or
FITS
.
IRAS10565:
pdf
, or
FITS
.
J1522+3144:
pdf
, or
FITS
.
J1102+2757:
pdf
, or
FITS
.
IRAS15250:
pdf
, or
FITS
.
Comments.
For each source, a CLEAN map resulting from the automated fringing and self-cal iterations (or phase-referencing) in the pipeline script.
The peak flux for 4C39.25 seems a little low.