
EVN User Experiment Pipeline Feedback
Last updated: Thu Jul 10 11:23:20 CEST 2014
surcis@jive.nl
General Comments.
(
Brief data summary
and
scan listing
)
ES071B was a methanol maser experiment at 6.7-GHz on 28 February 2014. The continuum pass used 8 EVN stations and a setup of 8 x 2 MHz IF, dual polarization, and 2 bit sampling, and it was correlated with 128 frequency points by using the software correlator. Here it is the pipelining results. In the pipelining, the SOLINT was set at 1.0 min and Ef was used as the reference station. J2202+4216 was both fringe-finder and bandpass calibrator. The target maser source was Cepheus A and J2302+6405 was the phase-referencing calibrator.
The EVN reliability indicator (ERI) for this experiment was
ERI = 0.91 . ERI* = 0.98 .
(Ef=1, Wb=1, Jb=1, On=1, Mc=1, Nt=0.95, Tr=0.98, Ys=0.72).
Plots of the autocorrelations
Comments.
Each scan plotted separately, all stations. The methanol maser line is detected in IF3 but **-Tr.
plots of the uncalibrated amplitude and phase
against time
Comments.
Full-experiment on Ef-* baselines, no calibration applied. A 1.5-minute plot-averaging was used.
Plots of the uncalibrated amplitude and phase
against frequency channel
Comments.
Scalar averaged Ef-* baselines, each scan plotted separately. No calibration applied yet. Maser line was detected on all the baselines but **-Tr.
The uncalibrated amplitude and phase of the crosshand
correlations against frequency channel
Comments.
Scalar averaged Ef-* baselines for LR, each scan plotted separately. No calibration applied yet. Maser line was clearly detected in IF3 on all baselines but **-Tr.
TSYS against time
Comments.
TY1 table.
Telescope sensitivities
from the a priori TSYS and Gain
curves (the square of this number gives the antenna noise (SEFD) in Jy - the
smaller the better).
Comments.
Gain amplitude from CL2 table.
Fringe-fit phase solutions
(including Parallactic
Angle correction).
Comments.
CL3 station phase solutions -- CL3 = CL2+SN2, thus also includes the initial amplitude/parallactic angle calibration from CL2 and the fringe solutions from SN2. No solutions for Tr.
Fringe-fit delay solutions
Comments.
SN2 station delay solutions for the fringed sources. No solutions for Tr.
Fringe-fit rate solutions
Comments.
SN2 station rate solutions. No solutions for Tr.
Telescope bandpasses
Comments.
Bandpass table 1.
Calibrated amplitude and phase against time
(a
priori amplitude calibration and fringe-fit solutions applied).
Comments.
Full-experiment for Ef-* baselines, calibrated with CL3.
Calibrated amplitude and phase against frequency
channel
Comments.
Ef-* baselines calibrated with CL3 and BP1. Methanol maser line in IF3 on all baselines but **-Tr.
Naturally weighted dirty map (not useful for bright sources)
produced before self-cal of:
CEPHEUSA:
pdf
, or
FITS
.
J2202+4216: pdf (not available)
, or
FITS (not available)
.
J1331+3030: pdf (not available)
, or
FITS (not available)
.
J2302+6405: pdf (not available)
, or
FITS (not available)
.
Comments.
Uniformly weighted dirty map (not useful for bright sources)
produced before self-cal of:
CEPHEUSA:
pdf
, or
FITS
.
J2202+4216: pdf (not available)
, or
FITS (not available)
.
J1331+3030: pdf (not available)
, or
FITS (not available)
.
J2302+6405: pdf (not available)
, or
FITS (not available)
.
Comments.
Phase corrections applied to a priori calibrated and
fringe-fitted data by self-calibration.
CEPHEUSA (not available)
.
J2202+4216
.
J1331+3030
.
J2302+6405
.
Comments.
Plots of post-SPLIT tables SN1 for the sources.
Amplitude corrections applied to a priori calibrated and
fringe-fitted data by self-calibration.
CEPHEUSA: pdf (not available)
, or
text file (not available)
, or
statistical summary (not available)
.
J2202+4216:
pdf
, or
text file
, or
statistical summary
.
J1331+3030:
pdf
, or
text file
, or
statistical summary
.
J2302+6405:
pdf
, or
text file
, or
statistical summary
.
Comments.
As above, but for the post-SPLIT table SN2.
Telescope sensitivities
(the total AMP gain applied
during both a priori and self calibration; the square of this number gives the
antenna noise (SEFD) in Jy).
Comments.
CL4 gain-amp.
Residual closure phase (visibility closure phase with model closure phase subtracted) for:
CEPHEUSA (not available)
.
J2202+4216
.
J1331+3030
.
J2302+6405
.
Comments.
Separate files per (fringed) source, showing closure phase plots for all the triangles (not just Ef-*-*). Only stokes=I shown.
Calibrated visibilities and the source model of:
CEPHEUSA (not available)
.
J2202+4216
.
J1331+3030
.
J2302+6405
.
Comments.
For the fringed source, plots of amp/phase on Ef-* baselines, calibrated with (post-SPLIT) table CL3, with a model-line overplotted.
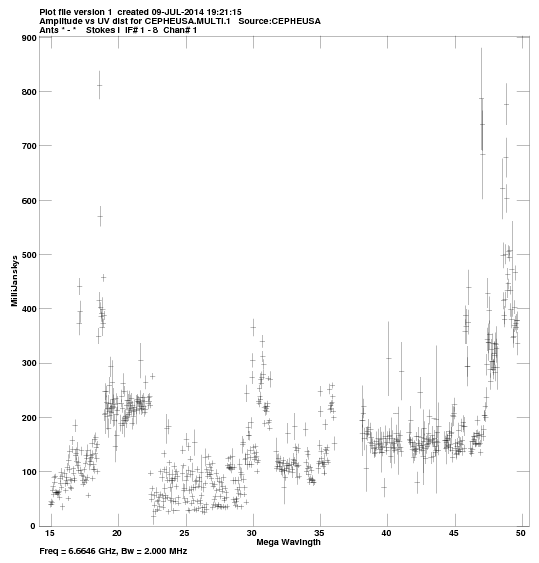
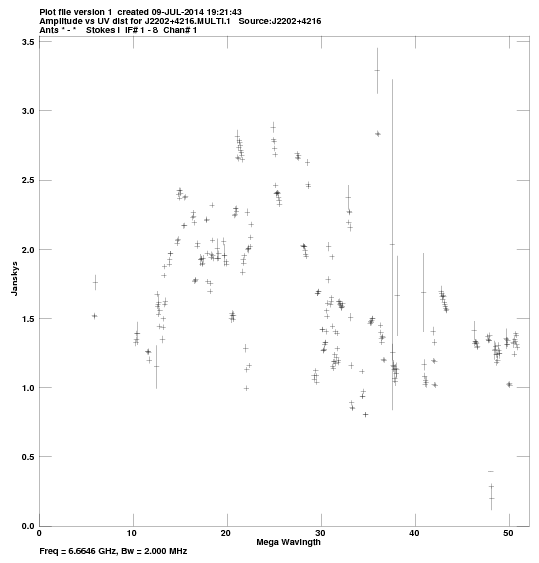
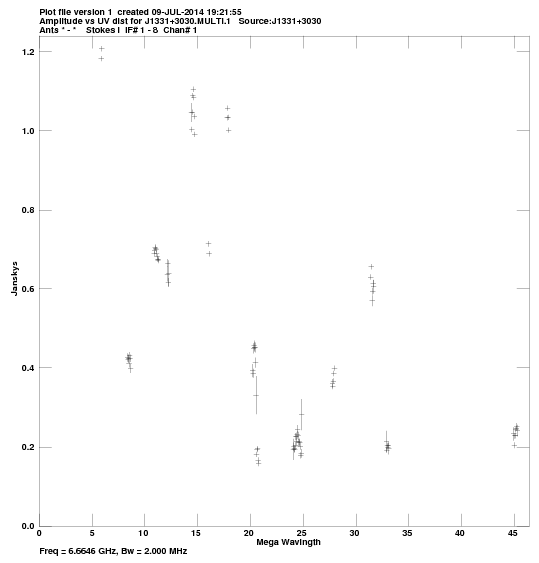
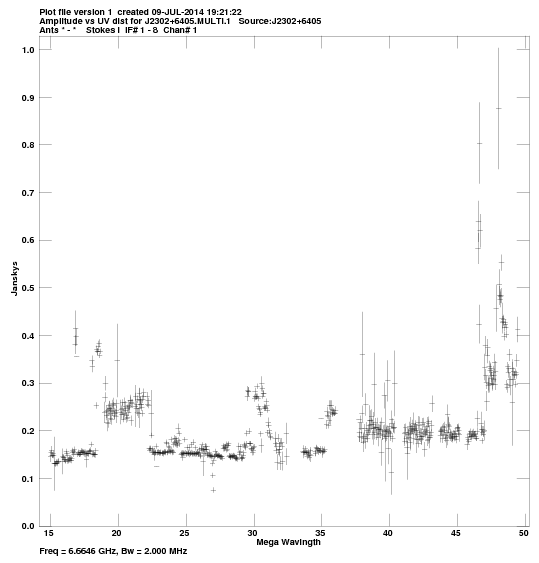
Calibrated visibilities against u,v distance for:
CEPHEUSA:
pdf
, or
png
.
J2202+4216:
pdf
, or
png
.
J1331+3030:
pdf
, or
png
.
J2302+6405:
pdf
, or
png
.
Comments.
For each source, a plot of amp vs. |uv| distance.
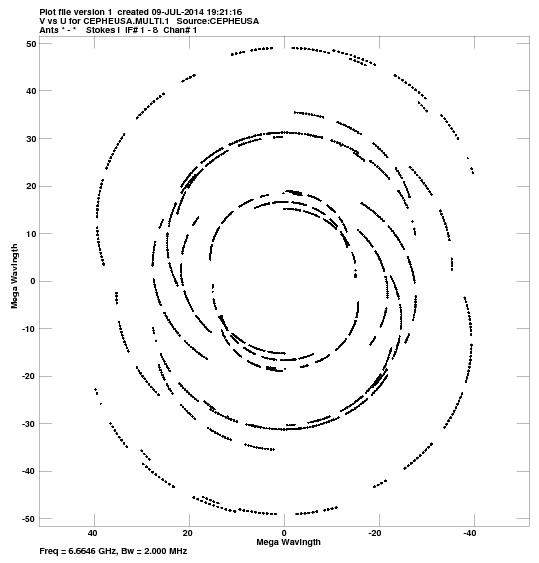
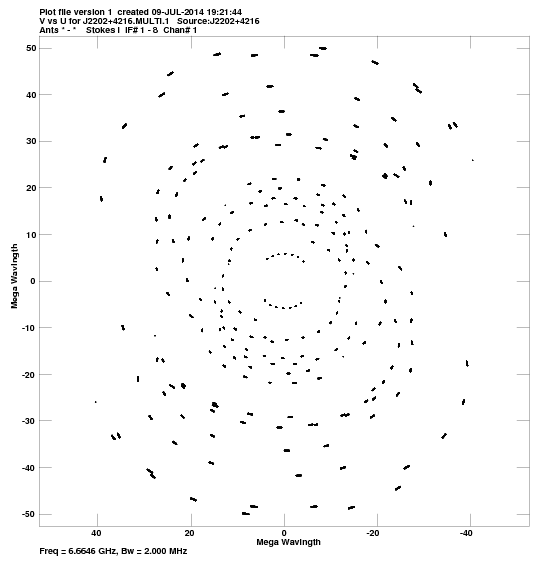
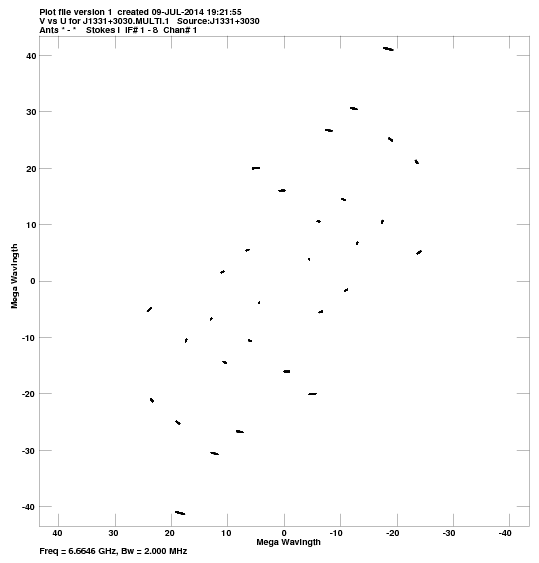
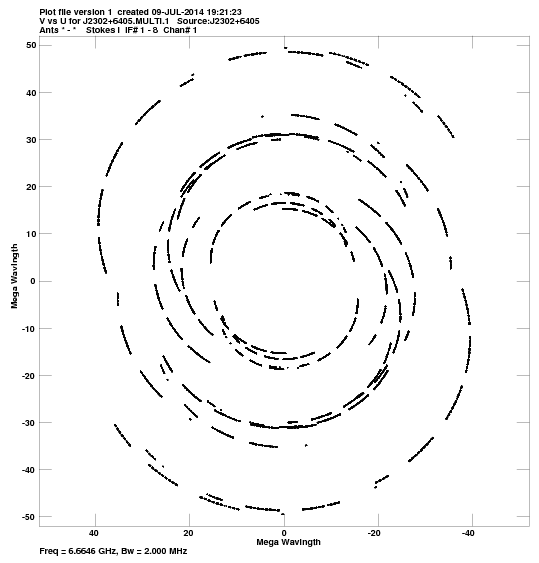
u,v coverage for:
CEPHEUSA:
pdf
, or
png
.
J2202+4216:
pdf
, or
png
.
J1331+3030:
pdf
, or
png
.
J2302+6405:
pdf
, or
png
.
Comments.
For each source, a plot of the u-v coverage.
Crude maps of sources:
CEPHEUSA:
pdf
, or
FITS
.
J2202+4216:
pdf
, or
FITS
.
J1331+3030:
pdf
, or
FITS
.
J2302+6405:
pdf
, or
FITS
.
Comments.
For each source, a CLEAN map resulting from the automated fringing and self-cal iterations in the pipeline script.