
EVN User Experiment Pipeline Feedback
Last updated: Thu Feb 4 11:40:31 CET 2016
mao@jive.eu
General Comments.
(
Brief data summary
and
scan listing
)
X band (3.6cm) NME, observed on 24 October 2015. Data rate was 512 Mbps (8 X 8 MHz subbands, full polarization, two-bit sampling). The observation comprises integrations on strong calibrators for ftp-fringe tests. 12 (13) stations scheduled, however only 10 stations are included below. UR detected no fringes and IR has not (yet?) sent data. KM was scheduled, but did not participate in the observations. The ERI below does not include KM.
The EVN reliability indicator (ERI) for this experiment was
ERI = 0.68 . ERI* = 0.68 .
The ERI* value takes into account that:
- UR did not detect any fringes
- IR has not (yet?) sent data.
The ERI value also takes into account losses that are outside the station's control, of which there were none for this experiment.
Plots of the autocorrelations
Comments.
Each scan plotted separately, all stations.
Plots of the uncalibrated amplitude and phase
against time
Comments.
Full-experiment for Ef-* baselines, no calibration applied. A 1.5 minute plot-averaging was used.
Plots of the uncalibrated amplitude and phase
against frequency channel
Comments.
Scalar averaged Ef-* baselines, each scan plotted separately. No calibration applied yet. Note that SH and NT are RCP only, and NT puts their RCP signal through LCP...
The uncalibrated amplitude and phase of the crosshand
correlations against frequency channel
Comments.
Scalar averaged Ef-* baselines for LR, each scan plotted separately. No calibration applied yet.
TSYS against time
Comments.
TY1 table, each IF/pol on a separate plot. SH uses nominal Tsys. MC looks odd... like 2 tracks?
Telescope sensitivities
from the a priori TSYS and Gain
curves (the square of this number gives the antenna noise (SEFD) in Jy - the
smaller the better).
Comments.
Gain amplitude from CL2 table.
Fringe-fit phase solutions
(including Parallactic
Angle correction).
Comments.
CL3 station phase solutions -- CL3 = CL2+SN2, thus also includes the initial amplitude/parallactic angle calibration from CL2 and the fringe solutions from SN2.
Fringe-fit delay solutions
Comments.
SN2 station delay solutions for the fringed sources, each IF/pol on a separate plot.
Fringe-fit rate solutions
Comments.
SN2 station rate solutions.
Telescope bandpasses
Comments.
Bandpass table 1. J1642+3948 was used for bandpass calibration.
Calibrated amplitude and phase against time
(a
priori amplitude calibration and fringe-fit solutions applied).
Comments.
Full-experiment for Ef-* baselines, calibrated with CL3. A 1.5 minute plot-averaging was used.
Calibrated amplitude and phase against frequency
channel
Comments.
Ef-* baselines calibrated with CL3 and BP1. The amp and phase plots self-scale, not necessarily going down to 0 in the case of the amps. Probably should have flagged NT LL because it doesn't exist...
Naturally weighted dirty map (not useful for bright sources)
produced before self-cal of:
J1642+3948: pdf (not available)
, or
FITS (not available)
.
J1800+3848: pdf (not available)
, or
FITS (not available)
.
Comments.
Naturally weighted dirty maps of phase-referenced sources. na.
Uniformly weighted dirty map (not useful for bright sources)
produced before self-cal of:
J1642+3948: pdf (not available)
, or
FITS (not available)
.
J1800+3848: pdf (not available)
, or
FITS (not available)
.
Comments.
Uniformly weighted dirty maps of phase-referenced sources. na.
Phase corrections applied to a priori calibrated and
fringe-fitted data by self-calibration.
J1642+3948
.
J1800+3848
.
Comments.
Plots of post-SPLIT tables SN1 for the sources that have been individually fringed.
Amplitude corrections applied to a priori calibrated and
fringe-fitted data by self-calibration.
J1642+3948:
pdf
, or
text file
, or
statistical summary
.
J1800+3848:
pdf
, or
text file
, or
statistical summary
.
Comments.
As above, but for the post-SPLIT table SN2.
Telescope sensitivities
(the total AMP gain applied
during both a priori and self calibration; the square of this number gives the
antenna noise (SEFD) in Jy).
Comments.
CL4 gain-amp.
Residual closure phase (visibility closure phase with model closure phase subtracted) for:
J1642+3948
.
J1800+3848
.
Comments.
Separate files per (fringed) source, showing closure phase plots for all the triangles. Only stokes=I shown.
Calibrated visibilities and the source model of:
J1642+3948
.
J1800+3848
.
Comments.
For each (fringed) source, plots of amp/phase on Ef-* baselines, calibrated with (post-SPLIT) table CL3, with a model-line overplotted.
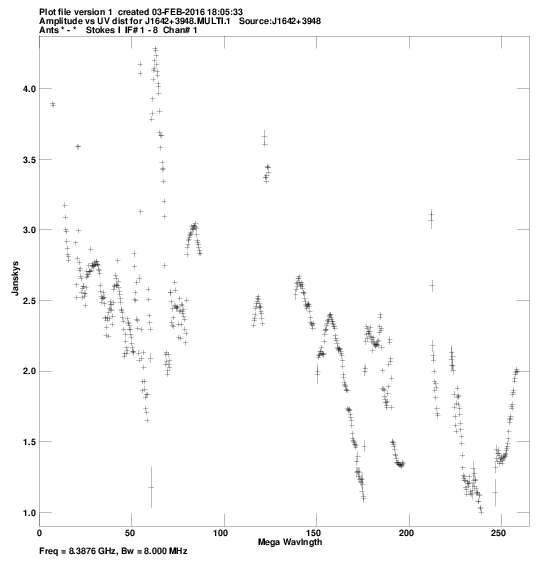
Calibrated visibilities against u,v distance for:
J1642+3948:
pdf
, or
png
.
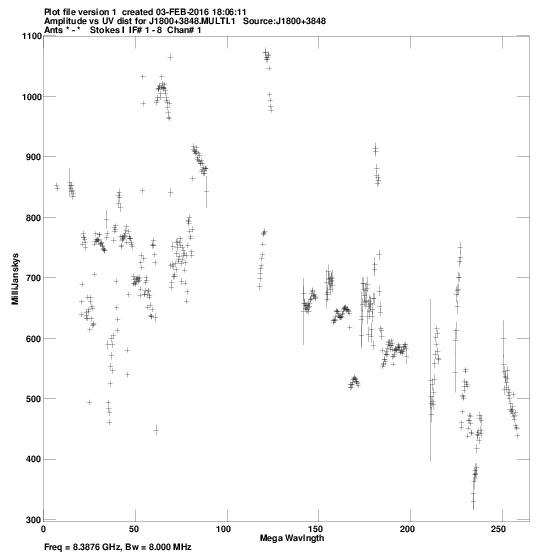
J1800+3848:
pdf
, or
png
.
Comments.
For each source, a plot of amp vs. |uv| distance.
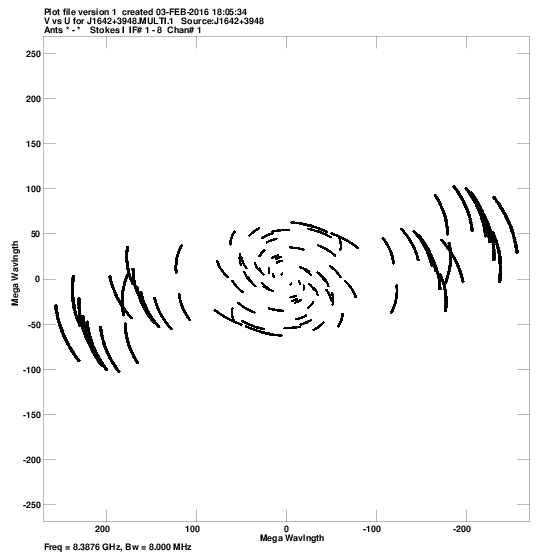
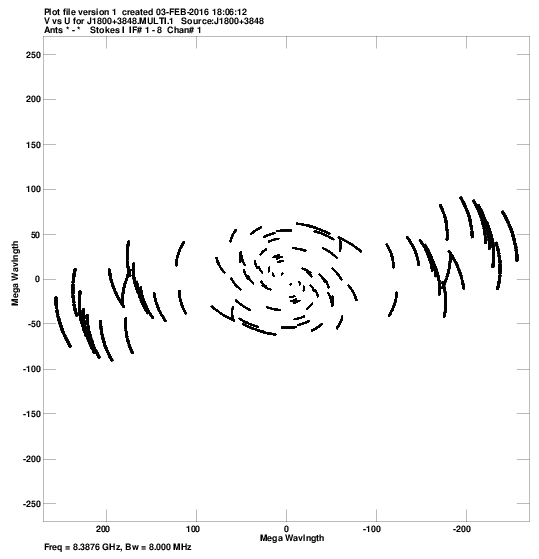
u,v coverage for:
J1642+3948:
pdf
, or
png
.
J1800+3848:
pdf
, or
png
.
Comments.
For each source, a plot of the u-v coverage.
Crude maps of sources:
J1642+3948:
pdf
, or
FITS
.
J1800+3848:
pdf
, or
FITS
.
Comments.
For each source, a CLEAN map resulting from the automated fringing and self-cal iterations (or phase-referencing) in the pipeline script. The peak fluxes are as expected :) (cf Session 2)