
EVN User Experiment Pipeline Feedback
Last updated: Fri Mar 31 08:57:21 CEST 2006
campbell@jive.nl
General Comments.
(
Brief data summary
and
scan listing
)
RO001A had 10 stations, 8 8MHz IFs, and two polarizations. There were 16 frequency points per IF/pol, and integration times were 1s. Considerably more information is included in the experiment's cover letter on the standard-plots portion of the EVN Archive. In the pipelining, only J1743-0350 and J1745-0753 were fringed; RSOph was phase-referenced from J1743-0350. The SOLINT was 2.5min (scan lengths for J1743-0350).
The EVN reliability indicator (ERI) for this experiment was
ERI = 0.887 . ERI* = 0.887 .
The ERI was 0.887. The losses include Wb missing IF8 and Tr missing LCP in IF7-8 (both taken as 7/8 of a station), plus Ef leaving the array early to prepare for the following C-band RO001B. Lack of Cm signal in IFs 1-2,5-8 considered as a known loss due to the limits of the micro-wave link.
Plots of the autocorrelations
Comments.
390 pages, each scan plotted separately, all stations (~3p/scan).
plots of the uncalibrated amplitude and phase
against time
Comments.
80 pages, full-experiment for Ef-* & Wb-* baselines, no calibration applied. A 2min plot-averaging was used.
Plots of the uncalibrated amplitude and phase
against frequency channel
Comments.
533 pages, scalar averaged Ef-* & Wb-* baselines, each scan plotted separately. No calibration applied yet.
The uncalibrated amplitude and phase of the crosshand
correlations against frequency channel
(not available)
Comments.
TSYS against time
Comments.
18 pages, TY1 table, each IF/pol on a separate plot. A few high points in some stations around 0700-0730.
Telescope sensitivities
from the a priori TSYS and Gain
curves (the square of this number gives the antenna noise (SEFD) in Jy - the
smaller the better).
Comments.
18 pages, gain amplitude from CL2 table.
Fringe-fit phase solutions
(including Parallactic
Angle correction).
Comments.
17 pages, CL3 station phase solutions -- CL3 = CL2+SN2, thus also includes the initial amplitude/parallactic angle calibration from CL2 and the fringe solutions from SN2. Reference stations (Ef) plot shows the effect of the parallactic angle correction.
Fringe-fit delay solutions
Comments.
17 pages, SN2 station delay solutions for the fringed sources, each IF/pol on a separate plot. Outliers in Tr IF 8L last point. Note that Wb becomes the reference station after Ef leaves the array.
Fringe-fit rate solutions
Comments.
17 pages, SN2 station rate solutions. Outlier in last Ro IF 1,2R point.
Telescope bandpasses
Comments.
3 pages, bandpass table 1. Only J1745-0753 was used for bandpass calibration.
Calibrated amplitude and phase against time
(a
priori amplitude calibration and fringe-fit solutions applied).
Comments.
80 pages, full-experiment for Ef-* & Wb-* baselines, calibrated with CL3. The 2-min plot-averaging still applied.
Calibrated amplitude and phase against frequency
channel
Comments.
420 pages; Ef-* & Wb-* baselines calibrated with CL3 and BP1.
Naturally weighted dirty map (not useful for bright sources)
produced before self-cal of:
J1743-0350: pdf (not available)
, or
FITS (not available)
.
RSOPH:
pdf
, or
FITS
.
J1745-0753: pdf (not available)
, or
FITS (not available)
.
Comments.
Natural-weighted (dirty) maps for RSOph.
Uniformly weighted dirty map (not useful for bright sources)
produced before self-cal of:
J1743-0350: pdf (not available)
, or
FITS (not available)
.
RSOPH:
pdf
, or
FITS
.
J1745-0753: pdf (not available)
, or
FITS (not available)
.
Comments.
Uniform-weighted (dirty) map for RSOph.
Phase corrections applied to a priori calibrated and
fringe-fitted data by self-calibration.
J1743-0350
.
RSOPH (not available)
.
J1745-0753
.
Comments.
Plots of post-SPLIT tables SN1 for the sources J1743-0350 & J1745-0753. About 17 pages per source.
Amplitude corrections applied to a priori calibrated and
fringe-fitted data by self-calibration.
J1743-0350:
pdf
, or
text file
, or
statistical summary
.
RSOPH: pdf (not available)
, or
text file (not available)
, or
statistical summary (not available)
.
J1745-0753:
pdf
, or
text file
, or
statistical summary
.
Comments.
As above, but for the post-SPLIT table SN2.
Telescope sensitivities
(the total AMP gain applied
during both a priori and self calibration; the square of this number gives the
antenna noise (SEFD) in Jy).
Comments.
CL4 gain-amp.
Residual closure phase (visibility closure phase with model closure phase subtracted) for:
J1743-0350
.
RSOPH (not available)
.
J1745-0753
.
Comments.
Separate files per (fringed) source, showing closure phase plots for all the triangles (not just Ef-*-* or Wb-*-*). Only stokes=I shown.
Calibrated visibilities and the source model of:
J1743-0350
.
RSOPH (not available)
.
J1745-0753
.
Comments.
For each (fringed) source, plots of amp/phase on Ef-* & Wb-* baselines, calibrated with (post-SPLIT) table CL3, with a model-line overplotted.
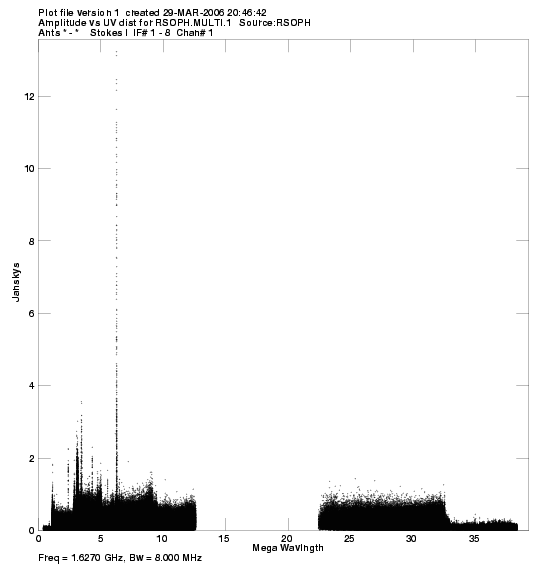
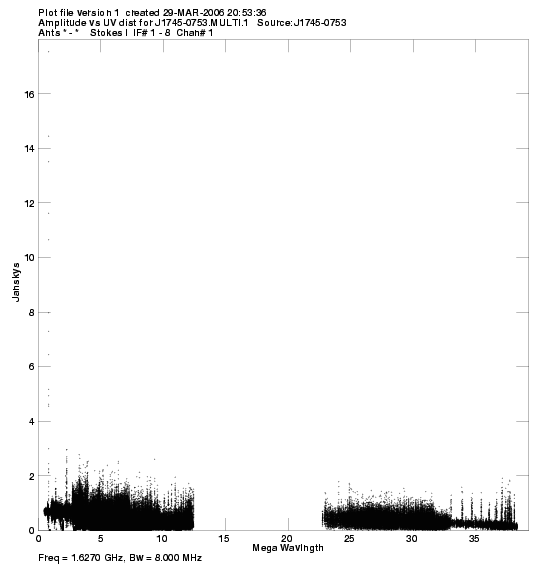
Calibrated visibilities against u,v distance for:
J1743-0350:
pdf
, or
png
.
RSOPH:
pdf
, or
png
.
J1745-0753:
pdf
, or
png
.
Comments.
For each source, a plot of amp vs. |uv| distance.
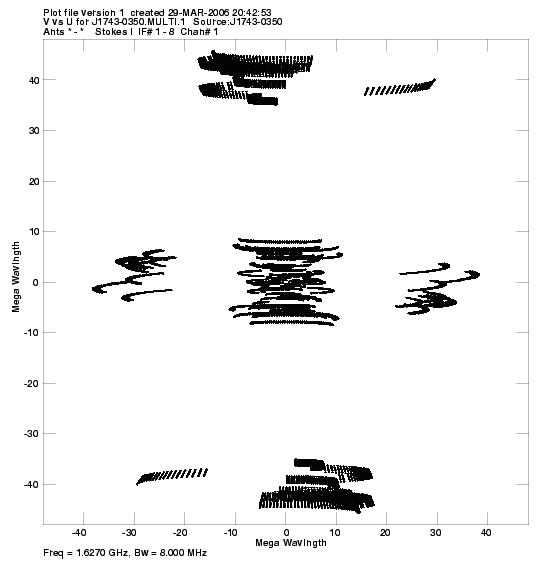
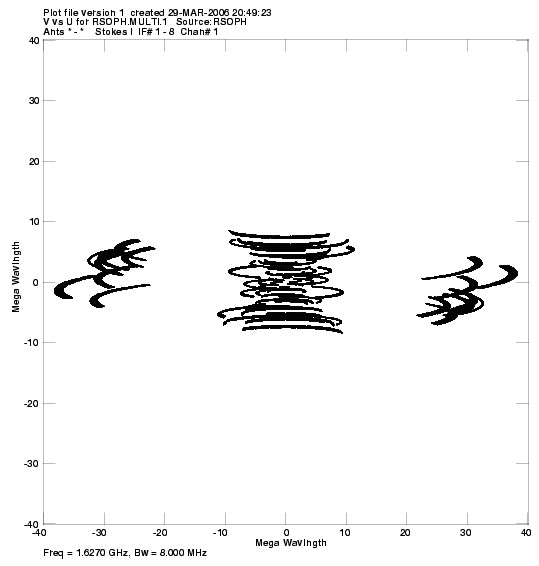
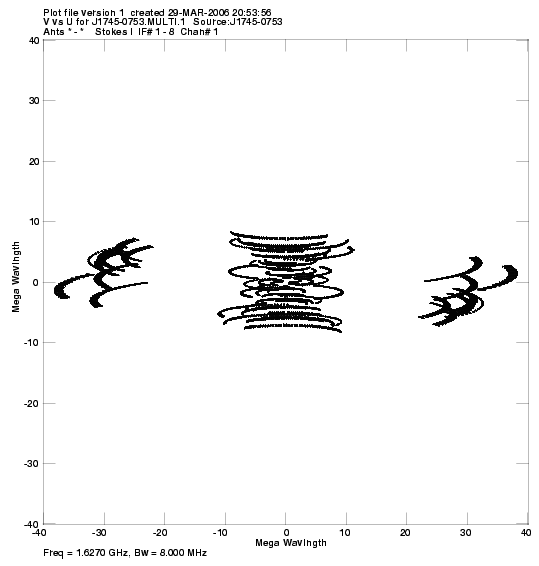
u,v coverage for:
J1743-0350:
pdf
, or
png
.
RSOPH:
pdf
, or
png
.
J1745-0753:
pdf
, or
png
.
Comments.
For each source, a plot of the u-v coverage.
Crude maps of sources:
J1743-0350:
pdf
, or
FITS
.
RSOPH:
pdf
, or
FITS
.
J1745-0753:
pdf
, or
FITS
.
Comments.
For each source, a CLEAN map resulting from the automated fringing/self-cal pipeline script.