
EVN User Experiment Pipeline Feedback
Last updated: Fri Dec 2 14:33:50 CET 2005
campbell@jive.nl
General Comments.
(
Brief data summary
and
scan listing
)
EJ007A had 9 stations, 4 8MHz IFs, and two polarizations. There were 16 frequency points per IF/pol, and integration times were 4s. Considerably more information is included in the experiment's cover letter on the standard-plots portion of the EVN Archive. In the pipelining, only J1147+2635, J1652+3902, J1605+3001, J1405+4056, 3C286, and OQ208 were fringed. The SOLINT was 2.0min.
The EVN reliability indicator (ERI) for this experiment was
ERI = 0.957 . ERI* = 0.957 .
The ERI was 0.957. The losses include Ef having problems at the beginning of the experiment starting up their replacement Mk4 formatter (3/4hr) and Tr's loss of IF2,RCP throughout the whole experiment (1/8 of total number of channels).
Plots of the autocorrelations
.
Comments.
252 pages, each scan plotted separately, all stations
Plots of the uncalibrated amplitude and phase against time
.
Comments.
16 pages, full-experiment for Jb-* baselines, no calibration applied. Each 4s integration plotted separately. The fringe-finders dominate the amplitude scale.
Plots of the uncalibrated amplitude and phase against frequency
channel
.
Comments.
252 pages, scalar averaged Jb-* baselines, each scan plotted separately.
The uncalibrated amplitude and phase of the crosshand
correlations against frequency channel
.
Comments.
126 pages, scalar averaged Jb-* baselines for Stokes=LR, each scan plotted separately (still uncalibrated).
TSYS against time
.
Comments.
TY1 table, each IF/pol on a separate plot. Tr IF2,RCP plot corresponds to a "dead" channel.
Telescope sensitivities
from the a priori TSYS and Gain curves (the square of this
number gives the antenna noise (SEFD) in Jy - the smaller the better).
Comments.
gain amplitude from CL2 table (same comment as above for Tr IF2,RCP)
Fringe-fit phase solutions
(including Parallactic Angle correction).
Comments.
CL3 station phase solutions -- CL3 = CL2+SN2, thus also includes the initial amplitude/parallactic angle calibration from CL2 and the fringe solutions from SN2. Jb remains the reference station; it's plot shows the effect of the parallactic angle correction.
Fringe-fit delay solutions
.
Comments.
SN2 station delay solutions for the fringed calibrators, each IF/pol on a separate plot. Tr used a Rb frequency standard throughout the session instead of the usual H-maser.
Fringe-fit rate solutions
.
Comments.
SN2 station rate solutions.
Telescope bandpasses
.
Comments.
bandpass table 1. Only 3C286 & OQ208 were used for bandpass calibration.
Calibrated amplitude and phase against time
(a priori amplitude calibration and fringe-fit solutions applied).
Comments.
Jb-* baselines calibrated with table CL3 -- ampitude scale still dominated by fringe-finders; more phases seen lined up ~0.
Calibrated amplitude and phase against frequency channel
.
Comments.
252 pages; Jb-* baselines calibrated with CL3 and BP1.
Naturally weighted dirty map produced before self-cal of:
J1147+2635:
postscript
, or
FITS
.
J1652+3902:
postscript
, or
FITS
.
J1605+3001:
postscript
, or
FITS
.
J1405+4056:
postscript
, or
FITS
.
3C286:
postscript
, or
FITS
.
OQ208:
postscript
, or
FITS
.
J1150+2819:
postscript
, or
FITS
.
J1603+3002:
postscript
, or
FITS
.
J1655+3945:
postscript
, or
FITS
.
J1413+4212:
postscript
, or
FITS
.
Comments.
Natural-weighted (dirty) maps for the sources.
Uniformly weighted dirty map produced before self-cal of:
J1147+2635:
postscript
, or
FITS
.
J1652+3902:
postscript
, or
FITS
.
J1605+3001:
postscript
, or
FITS
.
J1405+4056:
postscript
, or
FITS
.
3C286:
postscript
, or
FITS
.
OQ208:
postscript
, or
FITS
.
J1150+2819:
postscript
, or
FITS
.
J1603+3002:
postscript
, or
FITS
.
J1655+3945:
postscript
, or
FITS
.
J1413+4212:
postscript
, or
FITS
.
Comments.
Uniform-weighted (dirty) maps.
Phase corrections applied to a priori calibrated and fringe-fitted data by self-calibration.
J1147+2635.
J1652+3902.
J1605+3001.
J1405+4056.
3C286.
OQ208.
J1150+2819.
J1603+3002.
J1655+3945.
J1413+4212.
Comments.
Plots of post-SPLIT tables SN1 for the sources.
Amplitude corrections applied to a priori calibrated and fringe-fitted data by self-calibration.
J1147+2635:
postscript
, or
text file
.
J1652+3902:
postscript
, or
text file
.
J1605+3001:
postscript
, or
text file
.
J1405+4056:
postscript
, or
text file
.
3C286:
postscript
, or
text file
.
OQ208:
postscript
, or
text file
.
J1150+2819:
postscript
, or
text file
.
J1603+3002:
postscript
, or
text file
.
J1655+3945:
postscript
, or
text file
.
J1413+4212:
postscript
, or
text file
.
Comments.
As above, but for the post-SPLIT table SN2.
Telescope sensitivities
(the total AMP gain applied during
both a priori and self calibration; the square of this number gives the antenna
noise (SEFD) in Jy).
Comments.
CL4 gain-amp.
Residual closure phase (visibility closure phase with model closure phase subtracted) for:
J1147+2635
.
J1652+3902
.
J1605+3001
.
J1405+4056
.
3C286
.
OQ208
.
J1150+2819
.
J1603+3002
.
J1655+3945
.
J1413+4212
.
Comments.
about 34 pages per source, showing closure phase plots for all the triangles (not just Jb-*-*).
Calibrated visibilities and the source model of:
J1147+2635
.
J1652+3902
.
J1605+3001
.
J1405+4056
.
3C286
.
OQ208
.
J1150+2819
.
J1603+3002
.
J1655+3945
.
J1413+4212
.
Comments.
For each source, plots of amp/phase on Jb-* baselines calibrated with (post-SPLIT) table CL3, with a model-line overplotted.
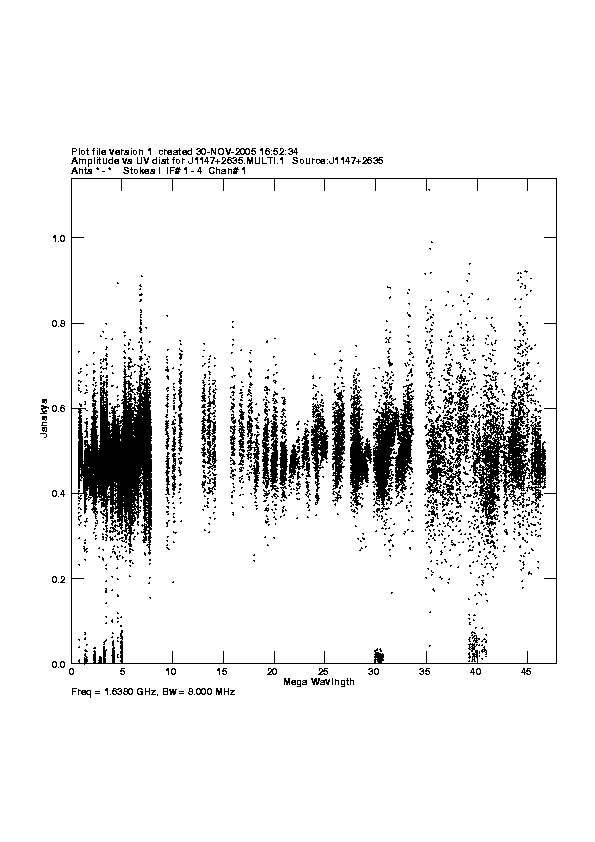
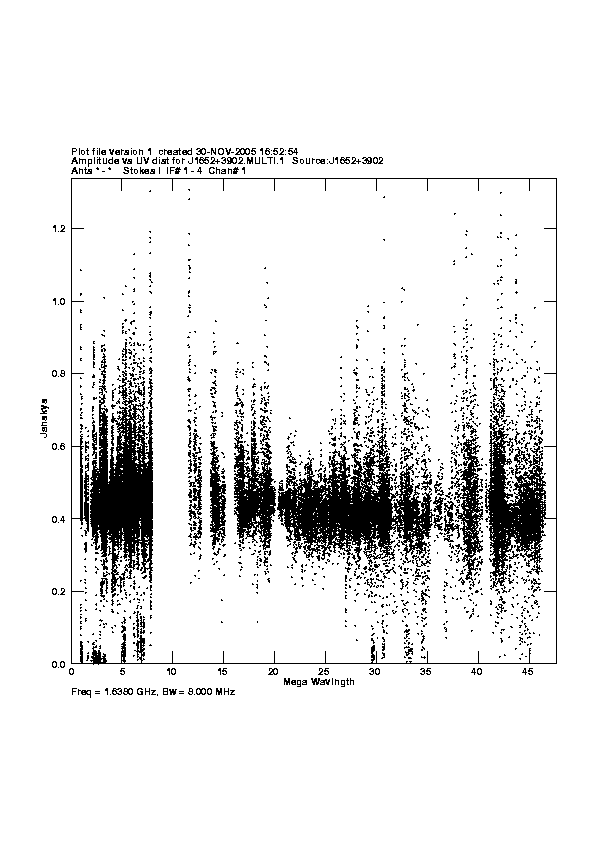
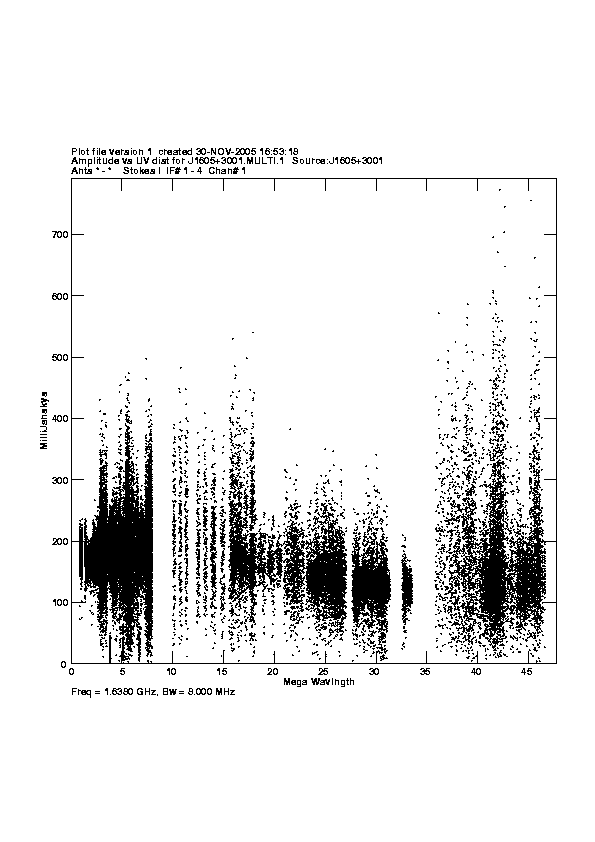
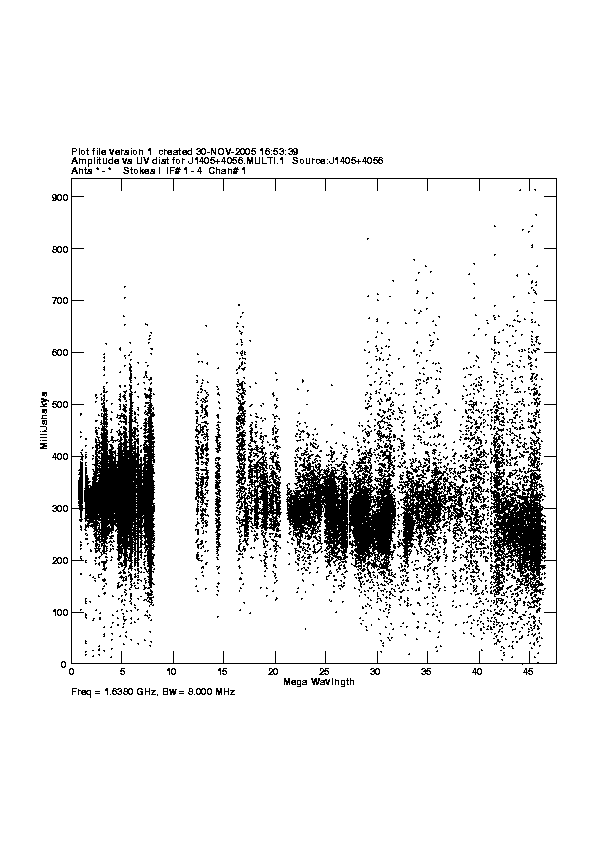
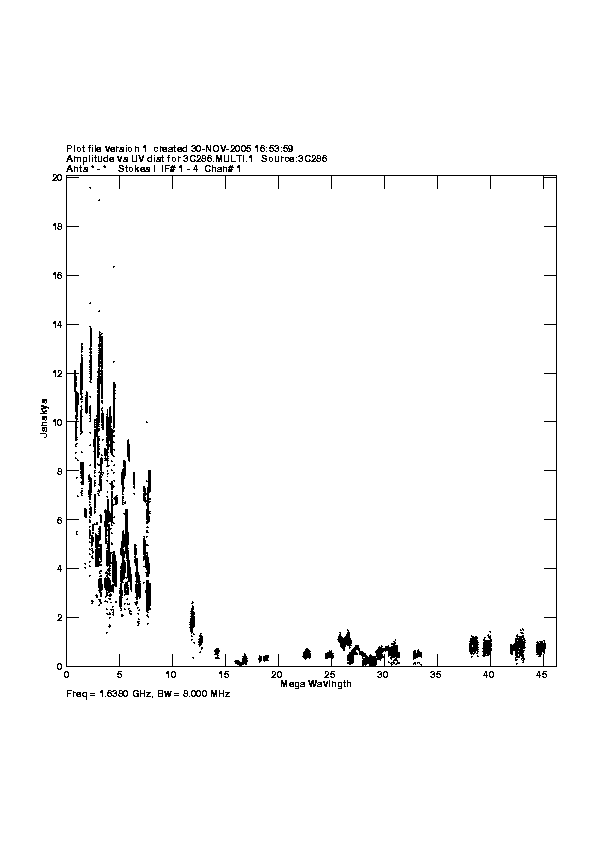
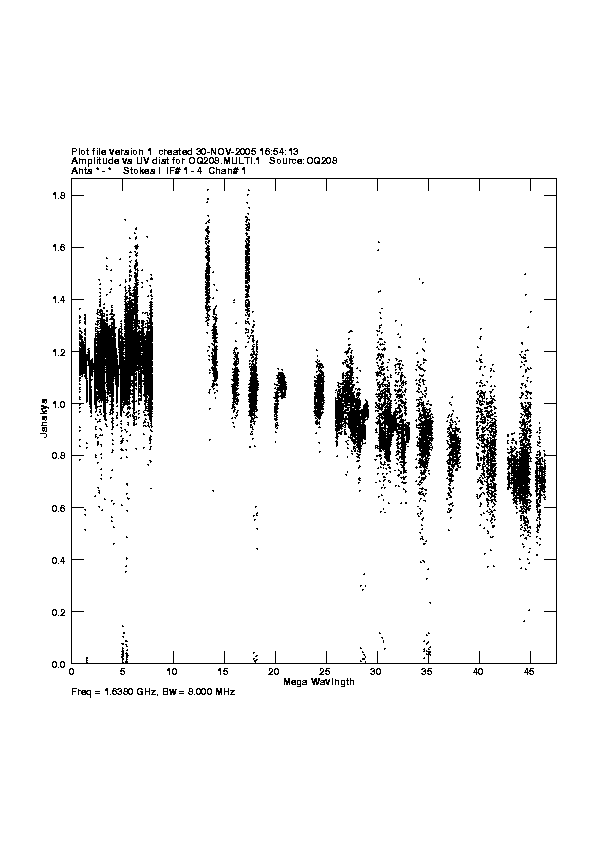
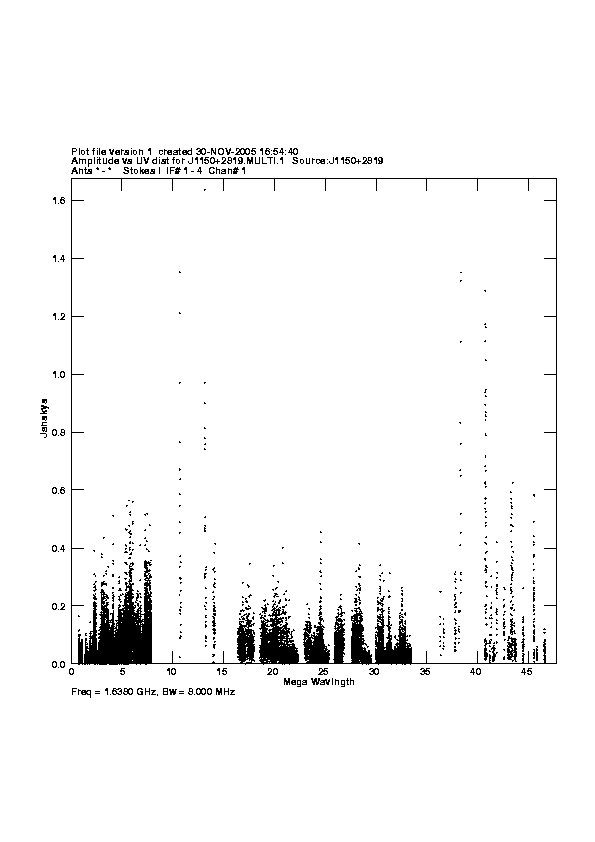
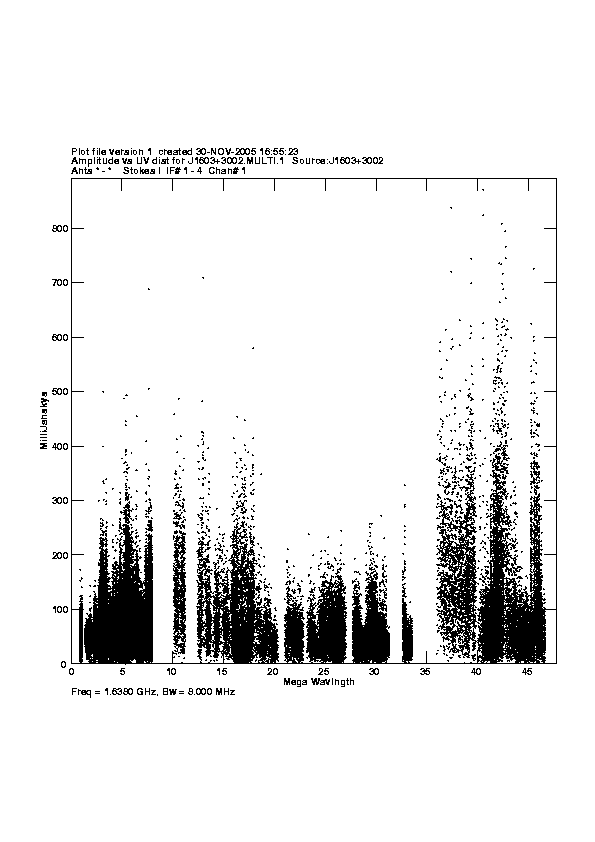
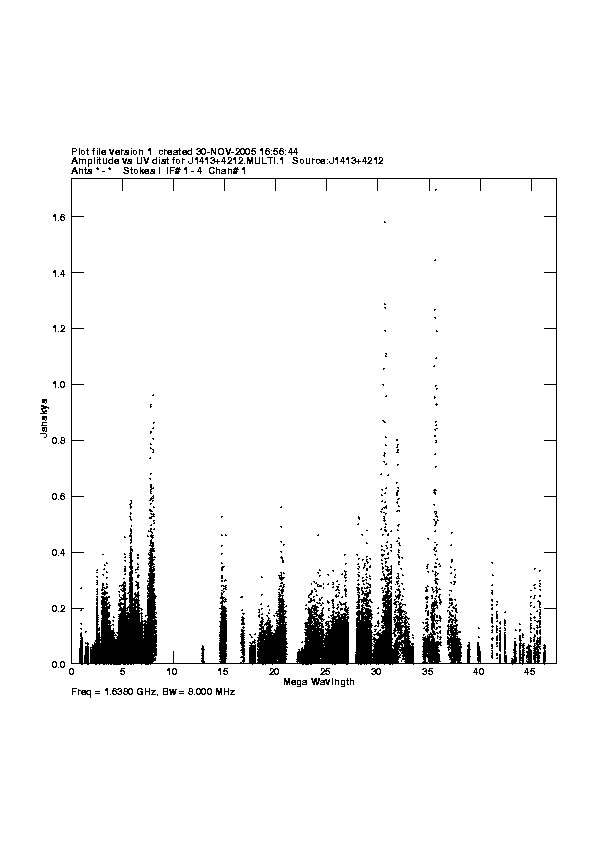
Calibrated visibilities against u,v distance for:
J1147+2635.
postscript
, or
png (smaller)
J1652+3902.
postscript
, or
png (smaller)
J1605+3001.
postscript
, or
png (smaller)
J1405+4056.
postscript
, or
png (smaller)
3C286.
postscript
, or
png (smaller)
OQ208.
postscript
, or
png (smaller)
J1150+2819.
postscript
, or
png (smaller)
J1603+3002.
postscript
, or
png (smaller)
J1655+3945.
postscript
, or
png (smaller)
J1413+4212.
postscript
, or
png (smaller)
Comments.
For each source, a plot of amp vs. |uv| distance. Some obvious high-biased points on individual baselines (spikes at a particular |uv|).
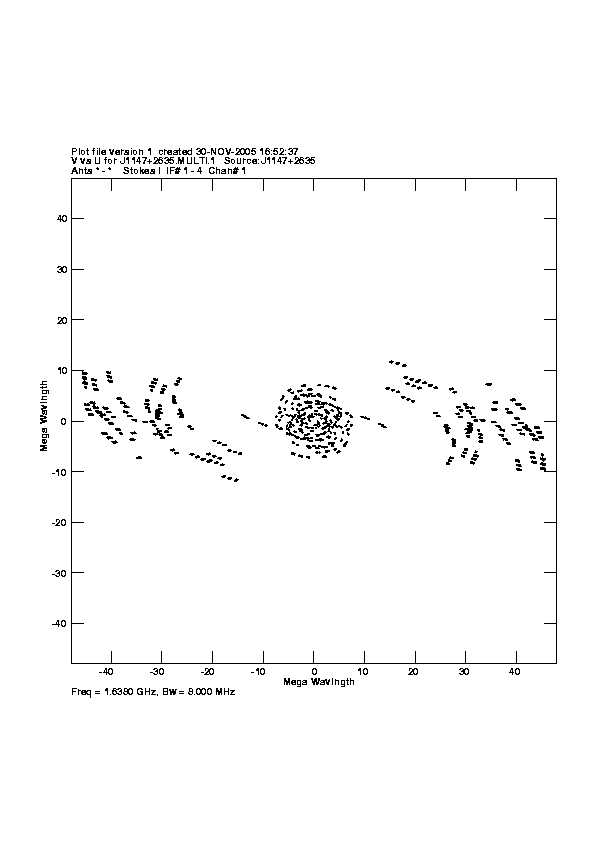
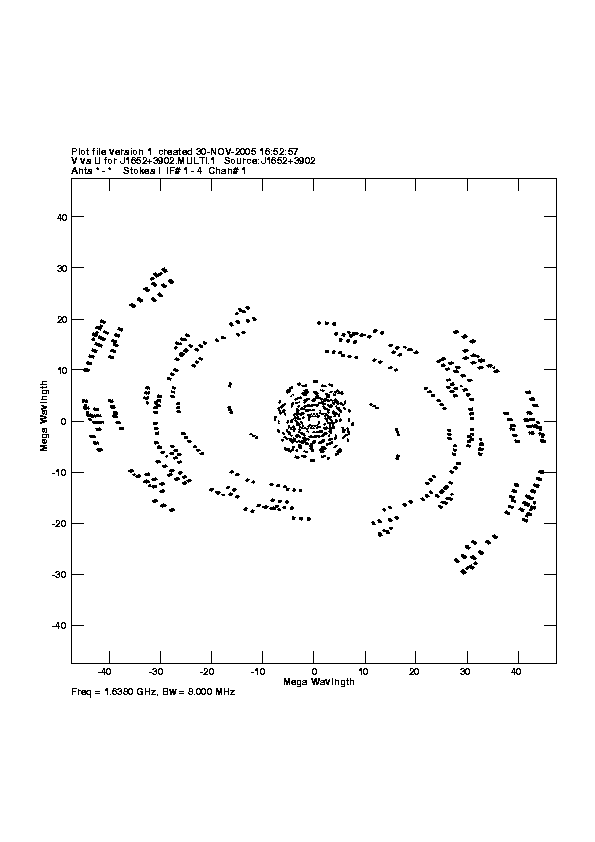
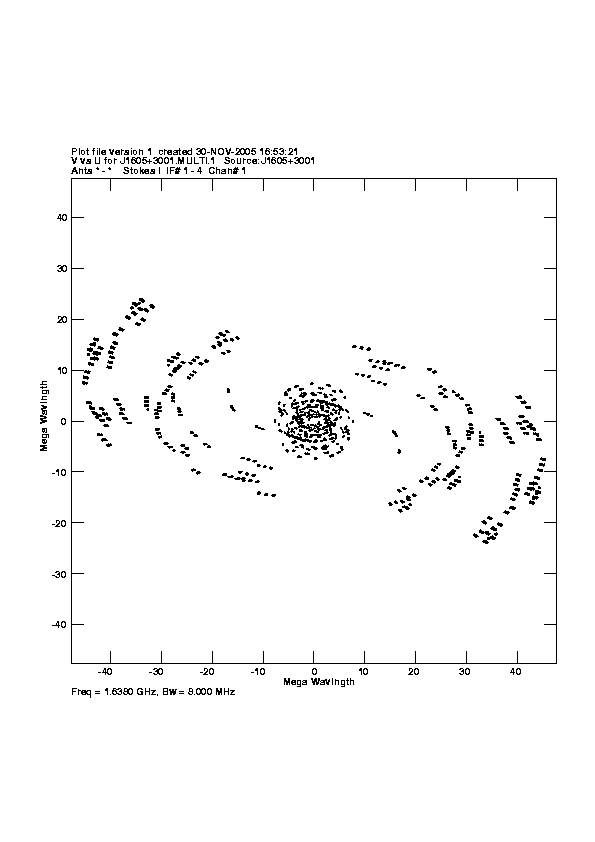
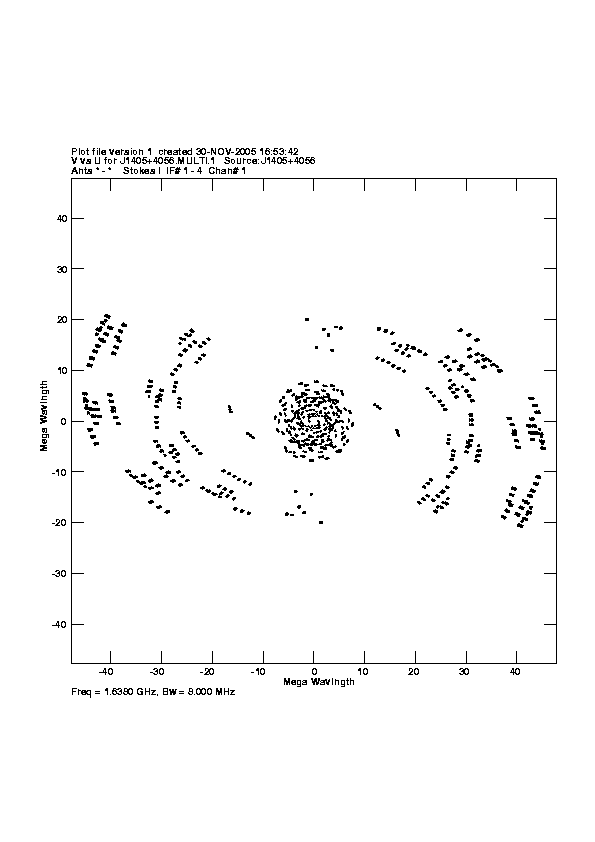
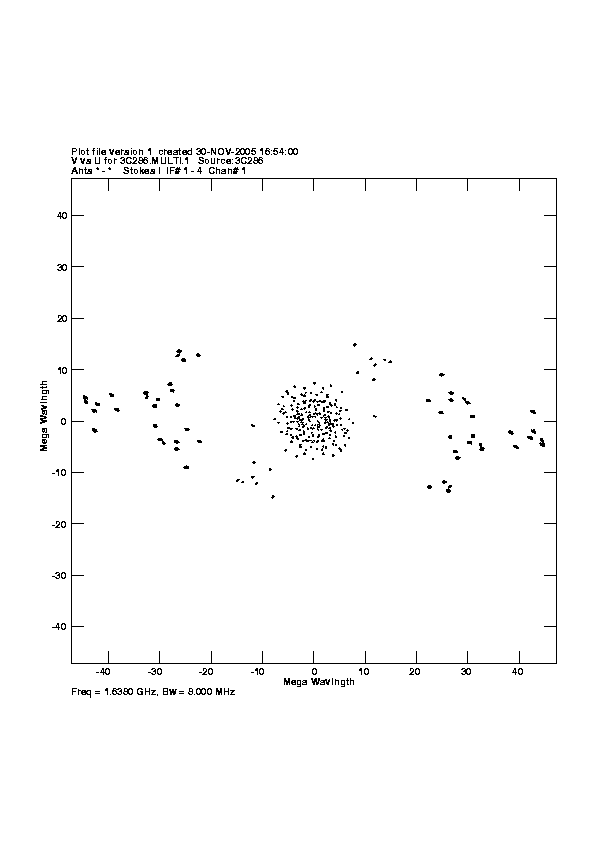
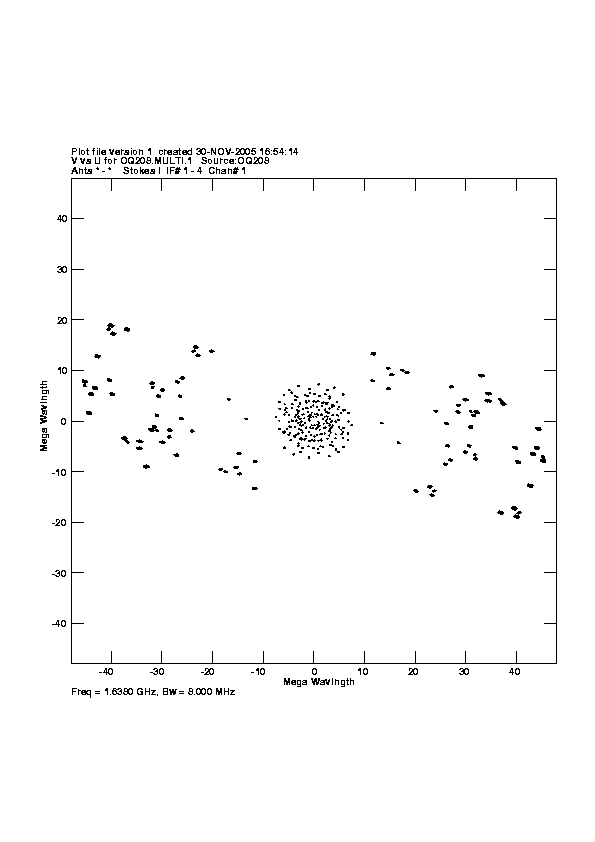
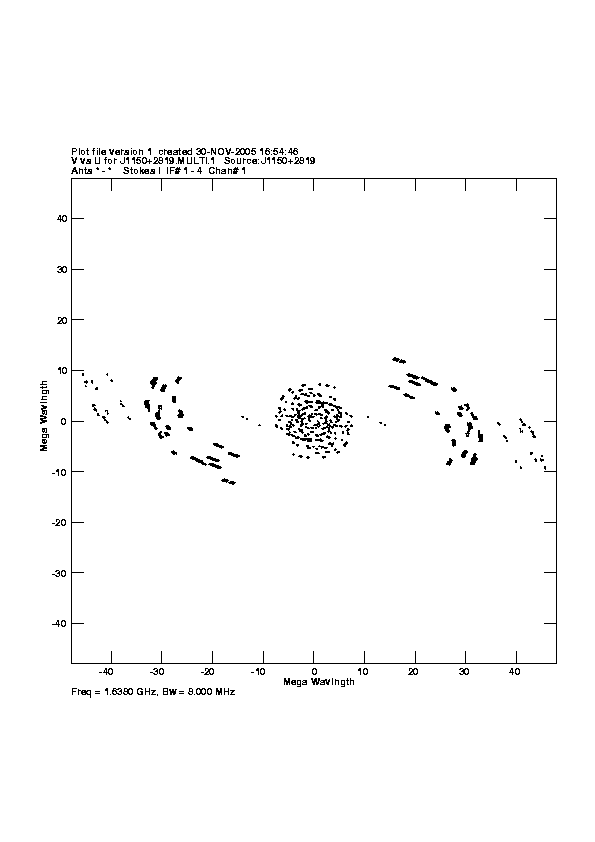
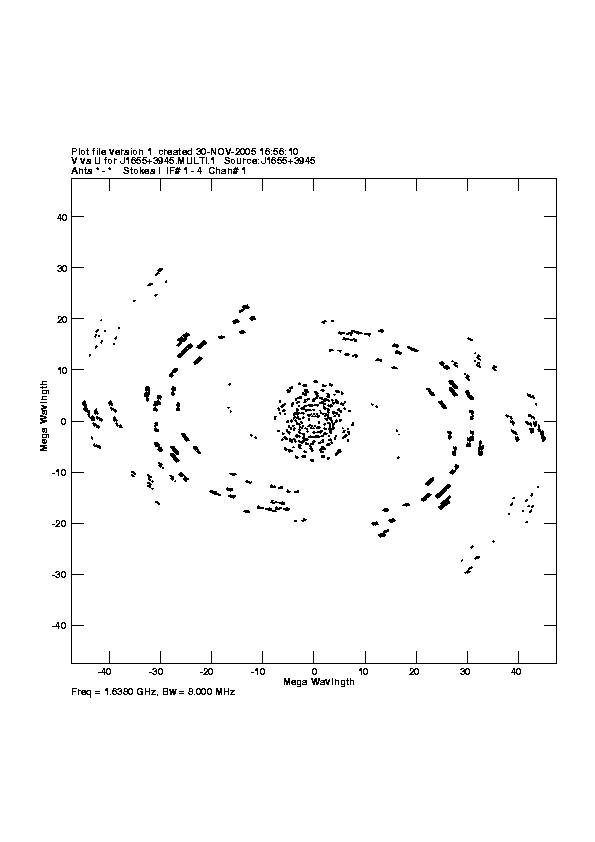
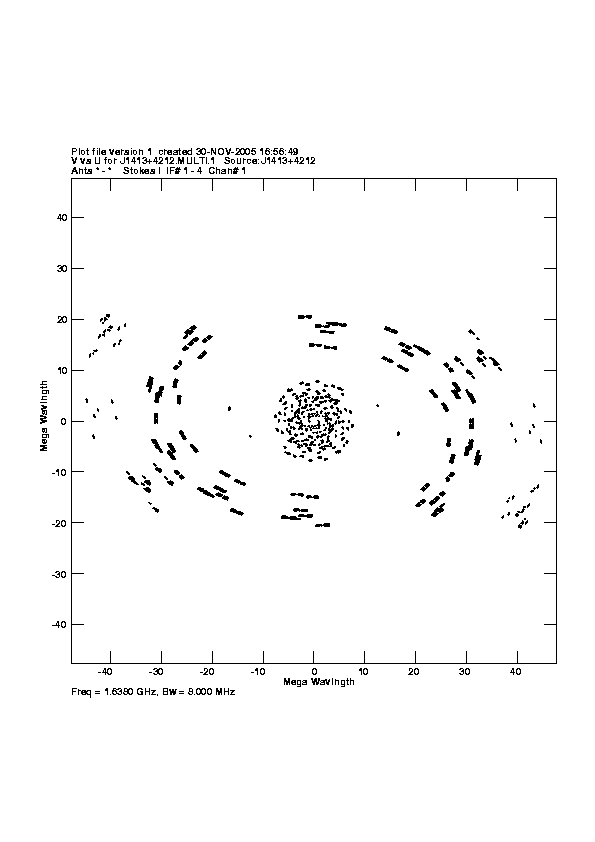
u,v coverage for:
J1147+2635.
postscript
, or
png (smaller)
J1652+3902.
postscript
, or
png (smaller)
J1605+3001.
postscript
, or
png (smaller)
J1405+4056.
postscript
, or
png (smaller)
3C286.
postscript
, or
png (smaller)
OQ208.
postscript
, or
png (smaller)
J1150+2819.
postscript
, or
png (smaller)
J1603+3002.
postscript
, or
png (smaller)
J1655+3945.
postscript
, or
png (smaller)
J1413+4212.
postscript
, or
png (smaller)
Comments.
For each source, a plot of the u-v coverage.
Crude maps of sources:
J1147+2635:
postscript
, or
FITS
.
J1652+3902:
postscript
, or
FITS
.
J1605+3001:
postscript
, or
FITS
.
J1405+4056:
postscript
, or
FITS
.
3C286:
postscript
, or
FITS
.
OQ208:
postscript
, or
FITS
.
J1150+2819:
postscript
, or
FITS
.
J1603+3002:
postscript
, or
FITS
.
J1655+3945:
postscript
, or
FITS
.
J1413+4212:
postscript
, or
FITS
.
Comments.
For each source, a CLEAN map resulting from the automated fringing/self-cal pipeline script.