
EVN User Experiment Pipeline Feedback
Last updated: Thu Jul 24 11:22:15 CEST 2014
campbell@jive.nl
General Comments.
(
Brief data summary
and
scan listing
)
EP088C had 13 good stations, 8 16MHz IFs, 4 polarizations, 32 frequency points per IF/pol, and 2s integrations. Considerably more information is included in the experiment's cover letter on the standard-plots portion of the EVN Archive. In the pipelining, the target sources were treated as phase-reference targets and were not separately fringe-fit. The SOLINT was set automatically to a value commensurate with a typical reference-source scan. Ef, and then On, were used as the reference stations.
The EVN reliability indicator (ERI) for this experiment was
ERI = 0.777 . ERI* = 0.899 .
The losses to ERI* include no fringes to Wb for about 2 hours, the late start in Zc and Bd, and no fringes in Tr IF1-2/RCP and 7-8/RCP and Ur IF3-4/RCP. The ERI also includes RFI-related effects (thus here treated as "weather" loss) flagged in the pipelining for Mc (IF 1,2,8), Sv (IF 1), and the upper-half of IF2 for everyone.
Plots of the autocorrelations
Comments.
Each scan plotted separately, all stations.
plots of the uncalibrated amplitude and phase
against time
Comments.
Full-experiment for Ef-* baselines, no calibration applied. A 1.5 minute plot-averaging was used.
Plots of the uncalibrated amplitude and phase
against frequency channel
Comments.
Scalar averaged Ef-* baselines, each scan plotted separately. No calibration applied yet.
The uncalibrated amplitude and phase of the crosshand
correlations against frequency channel
Comments.
Scalar averaged Ef-* baselines showing LR, each scan plotted separately. No calibration applied yet.
TSYS against time
Comments.
TY1 table, each IF/pol on a separate plot.
Telescope sensitivities
from the a priori TSYS and Gain
curves (the square of this number gives the antenna noise (SEFD) in Jy - the
smaller the better).
Comments.
Gain amplitude from CL2 table.
Fringe-fit phase solutions
(including Parallactic
Angle correction).
Comments.
CL3 station phase solutions -- CL3 = CL2+SN2, thus also includes the initial amplitude/parallactic angle calibration from CL2 and the fringe solutions from SN2.
Fringe-fit delay solutions
Comments.
SN2 station delay solutions for the fringed sources, each IF/pol on a separate plot.
Fringe-fit rate solutions
Comments.
SN2 station rate solutions. Some outliers in individual solints that throw off the automated phase-connection choices (e.g., On, Sh in a few IF/pols), as reflected in the FRING_PHAS plot. The time-series of fringe-rates tend towards higher values for stations forming longer baselines to Ef.
Telescope bandpasses
Comments.
Bandpass table 1. 3C454.3 and J1453+2648 were used for bandpass calibration (not all stations had detections on 3C454.3).
Calibrated amplitude and phase against time
(a
priori amplitude calibration and fringe-fit solutions applied).
Comments.
Full-experiment for Ef-* baselines, calibrated with CL3. The 1.5-min plot-averaging still applied.
Calibrated amplitude and phase against frequency
channel
Comments.
Ef-* baselines calibrated with CL3 and BP1. The amp and phase plots self-scale, not necessarily going down to 0 in the case of the amps.
Naturally weighted dirty map (not useful for bright sources)
produced before self-cal of:
CGCG448:
pdf
, or
FITS
.
J1824+5651: pdf (not available)
, or
FITS (not available)
.
J1102+2757: pdf (not available)
, or
FITS (not available)
.
3C454.3: pdf (not available)
, or
FITS (not available)
.
IRAS10565:
pdf
, or
FITS
.
J1522+3144: pdf (not available)
, or
FITS (not available)
.
NGC6670A:
pdf
, or
FITS
.
J1453+2648: pdf (not available)
, or
FITS (not available)
.
IRASF15250:
pdf
, or
FITS
.
NGC6090A:
pdf
, or
FITS
.
J1549+5038: pdf (not available)
, or
FITS (not available)
.
VV340A:
pdf
, or
FITS
.
J2108+1430: pdf (not available)
, or
FITS (not available)
.
Comments.
Naturally-weighted dirty maps of the phase-referenced-to sources.
Uniformly weighted dirty map (not useful for bright sources)
produced before self-cal of:
CGCG448:
pdf
, or
FITS
.
J1824+5651: pdf (not available)
, or
FITS (not available)
.
J1102+2757: pdf (not available)
, or
FITS (not available)
.
3C454.3: pdf (not available)
, or
FITS (not available)
.
IRAS10565:
pdf
, or
FITS
.
J1522+3144: pdf (not available)
, or
FITS (not available)
.
NGC6670A:
pdf
, or
FITS
.
J1453+2648: pdf (not available)
, or
FITS (not available)
.
IRASF15250:
pdf
, or
FITS
.
NGC6090A:
pdf
, or
FITS
.
J1549+5038: pdf (not available)
, or
FITS (not available)
.
VV340A:
pdf
, or
FITS
.
J2108+1430: pdf (not available)
, or
FITS (not available)
.
Comments.
Uniformly-weighted dirty maps of the phase-referenced-to sources.
Phase corrections applied to a priori calibrated and
fringe-fitted data by self-calibration.
CGCG448 (not available)
.
J1824+5651
.
J1102+2757
.
3C454.3
.
IRAS10565 (not available)
.
J1522+3144
.
NGC6670A (not available)
.
J1453+2648
.
IRASF15250 (not available)
.
NGC6090A (not available)
.
J1549+5038
.
VV340A (not available)
.
J2108+1430
.
Comments.
Plots of post-SPLIT tables SN1 for the sources that have been individually fringed.
Amplitude corrections applied to a priori calibrated and
fringe-fitted data by self-calibration.
CGCG448: pdf (not available)
, or
text file (not available)
, or
statistical summary (not available)
.
J1824+5651:
pdf
, or
text file
, or
statistical summary
.
J1102+2757:
pdf
, or
text file
, or
statistical summary
.
3C454.3:
pdf
, or
text file
, or
statistical summary
.
IRAS10565: pdf (not available)
, or
text file (not available)
, or
statistical summary (not available)
.
J1522+3144:
pdf
, or
text file
, or
statistical summary
.
NGC6670A: pdf (not available)
, or
text file (not available)
, or
statistical summary (not available)
.
J1453+2648:
pdf
, or
text file
, or
statistical summary
.
IRASF15250: pdf (not available)
, or
text file (not available)
, or
statistical summary (not available)
.
NGC6090A: pdf (not available)
, or
text file (not available)
, or
statistical summary (not available)
.
J1549+5038:
pdf
, or
text file
, or
statistical summary
.
VV340A: pdf (not available)
, or
text file (not available)
, or
statistical summary (not available)
.
J2108+1430:
pdf
, or
text file
, or
statistical summary
.
Comments.
As above, but for the post-SPLIT table SN2.
Telescope sensitivities
(the total AMP gain applied
during both a priori and self calibration; the square of this number gives the
antenna noise (SEFD) in Jy).
Comments.
CL4 gain-amp.
Residual closure phase (visibility closure phase with model closure phase subtracted) for:
CGCG448 (not available)
.
J1824+5651
.
J1102+2757
.
3C454.3
.
IRAS10565 (not available)
.
J1522+3144
.
NGC6670A (not available)
.
J1453+2648
.
IRASF15250 (not available)
.
NGC6090A (not available)
.
J1549+5038
.
VV340A (not available)
.
J2108+1430
.
Comments.
Separate files per (fringed) source, showing closure phase plots for all the triangles. Only stokes=I shown.
Calibrated visibilities and the source model of:
CGCG448 (not available)
.
J1824+5651
.
J1102+2757
.
3C454.3
.
IRAS10565 (not available)
.
J1522+3144
.
NGC6670A (not available)
.
J1453+2648
.
IRASF15250 (not available)
.
NGC6090A (not available)
.
J1549+5038
.
VV340A (not available)
.
J2108+1430
.
Comments.
For each (fringed) source, plots of amp/phase on Ef-* baselines, calibrated with (post-SPLIT) table CL3, with a model-line overplotted.
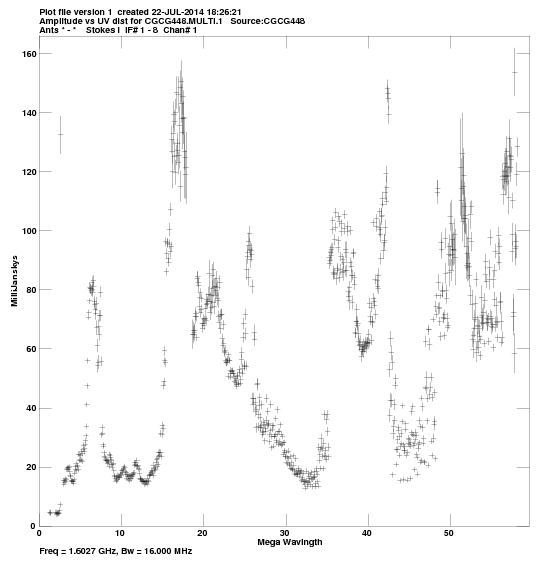
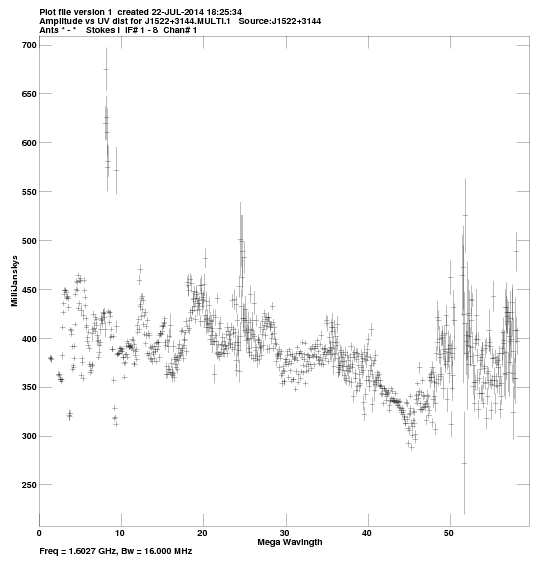
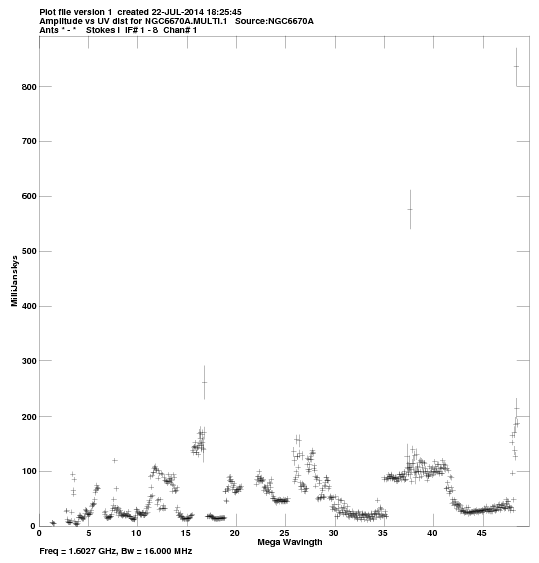
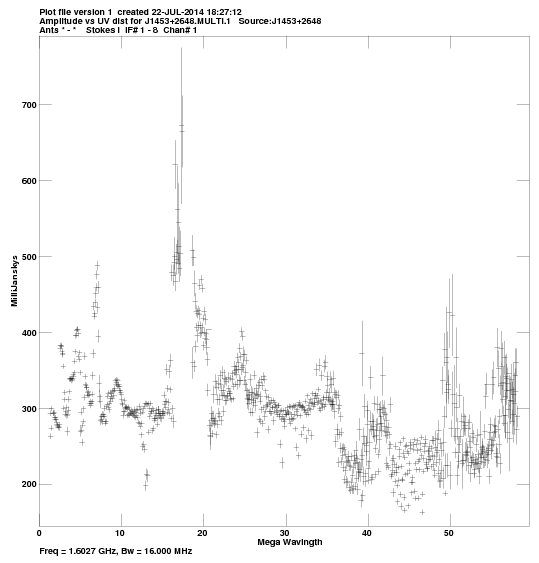
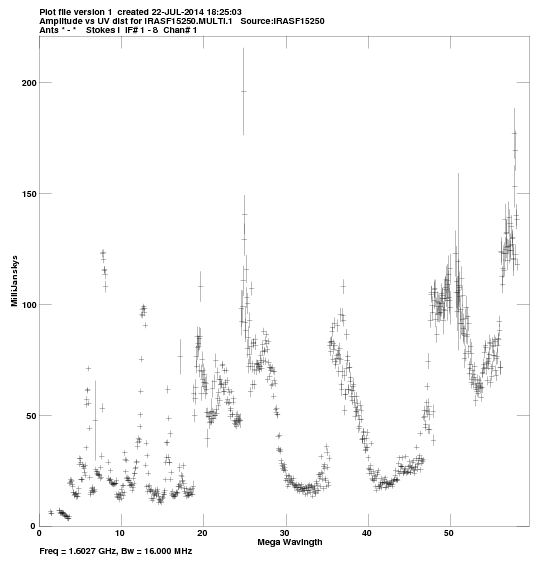
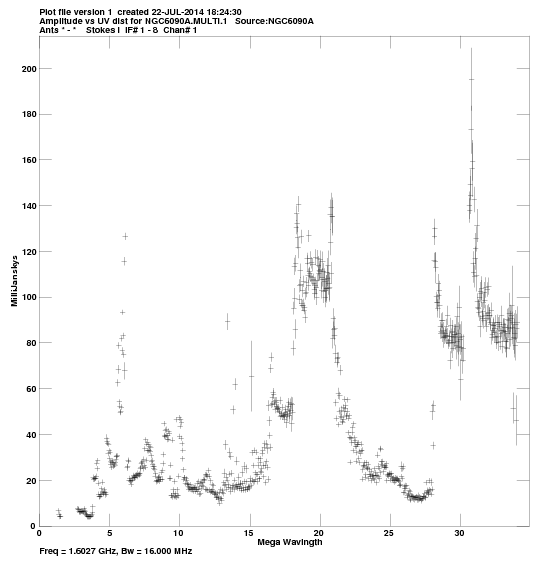
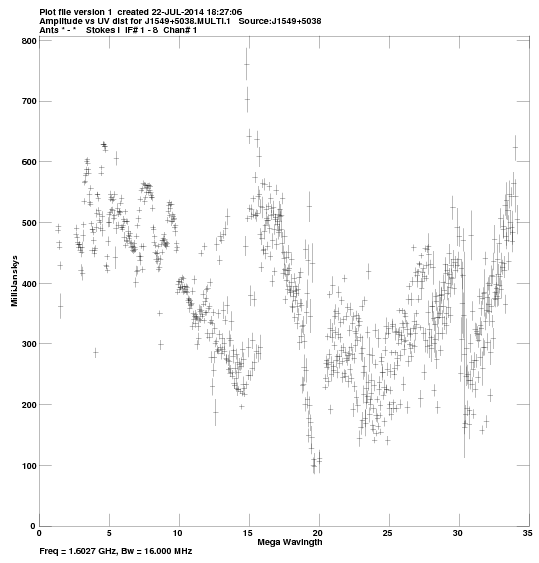
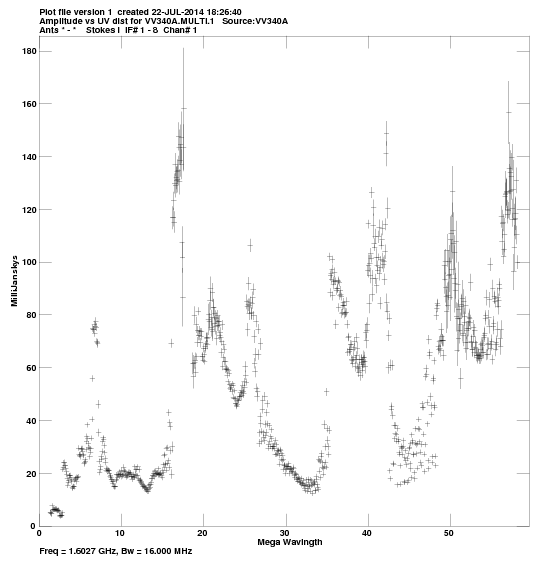
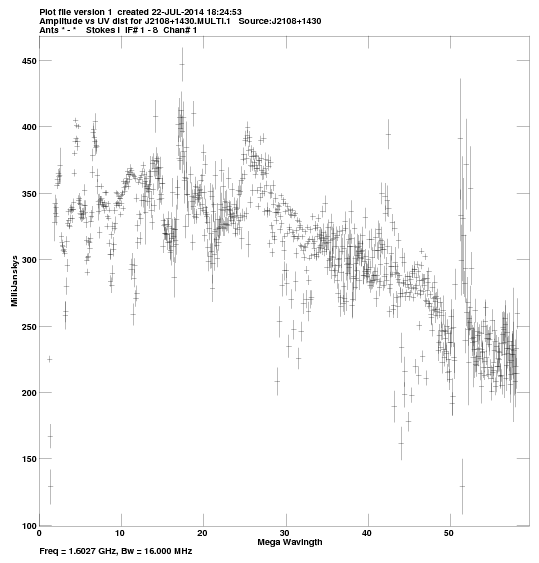
Calibrated visibilities against u,v distance for:
CGCG448:
pdf
, or
png
.
J1824+5651:
pdf
, or
png
.
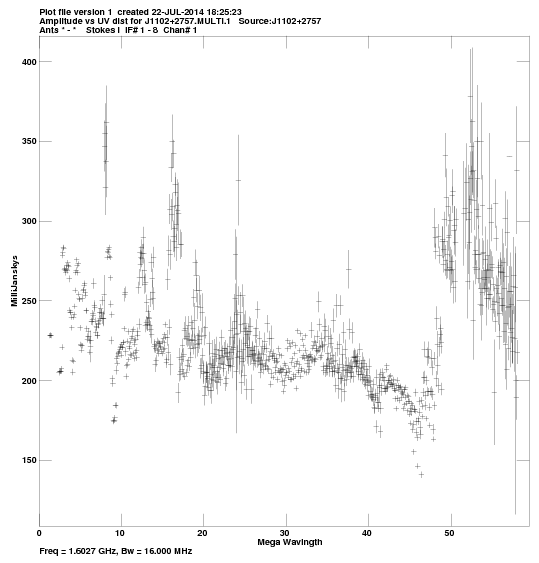
J1102+2757:
pdf
, or
png
.
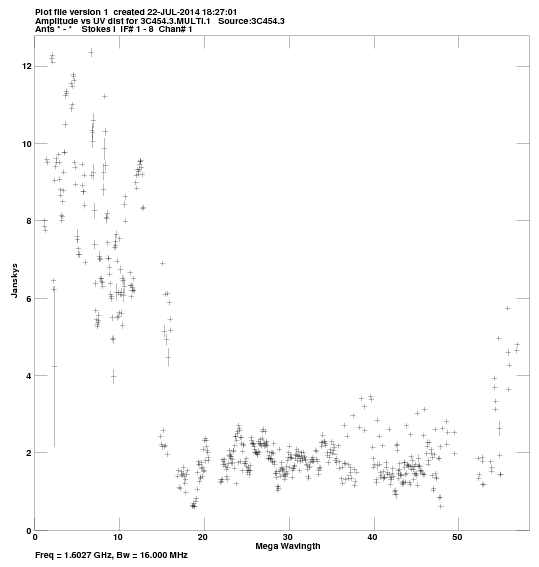
3C454.3:
pdf
, or
png
.
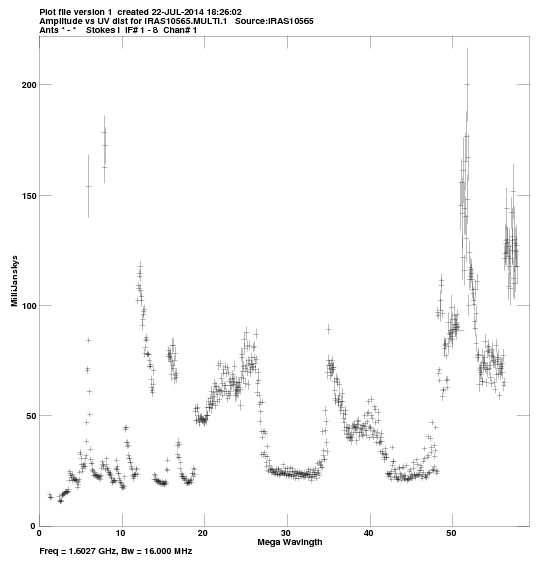
IRAS10565:
pdf
, or
png
.
J1522+3144:
pdf
, or
png
.
NGC6670A:
pdf
, or
png
.
J1453+2648:
pdf
, or
png
.
IRASF15250:
pdf
, or
png
.
NGC6090A:
pdf
, or
png
.
J1549+5038:
pdf
, or
png
.
VV340A:
pdf
, or
png
.
J2108+1430:
pdf
, or
png
.
Comments.
For each source, a plot of amp vs. |uv| distance.
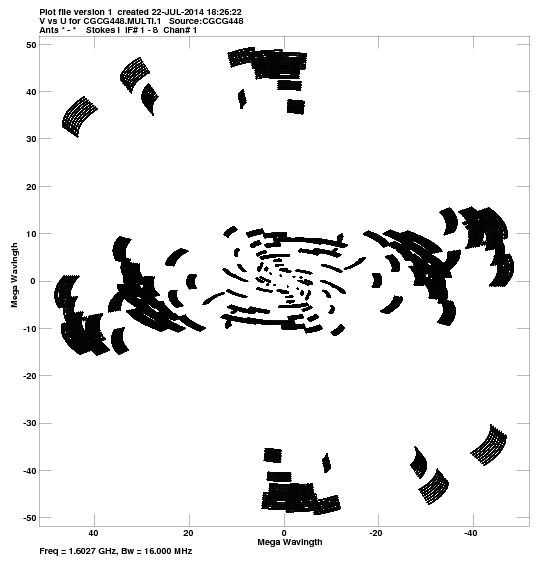
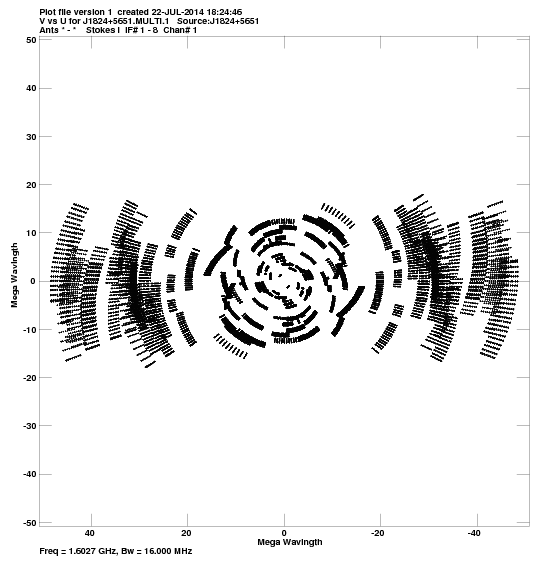
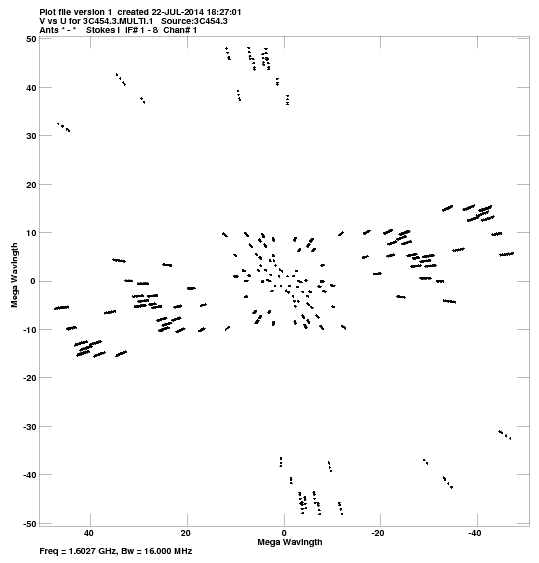
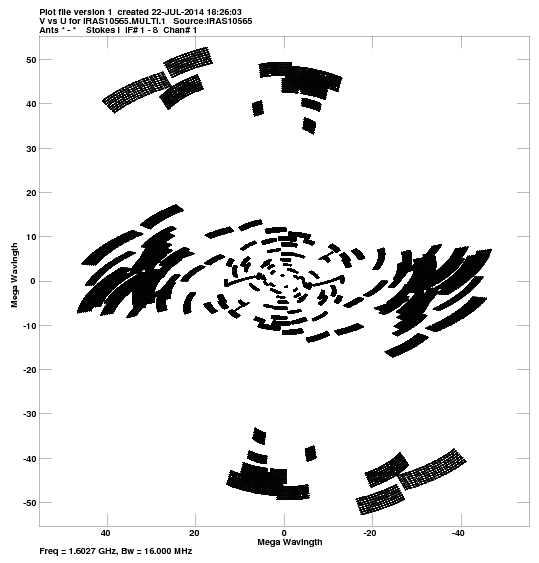
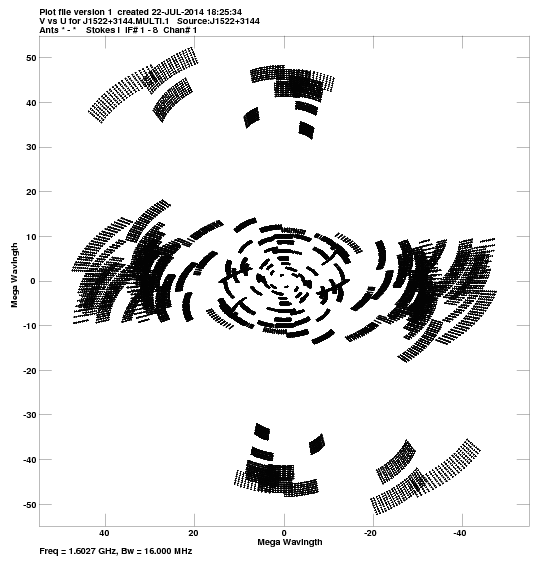
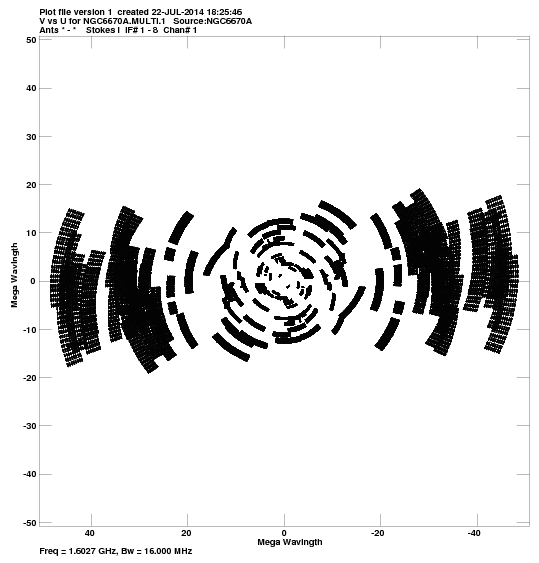
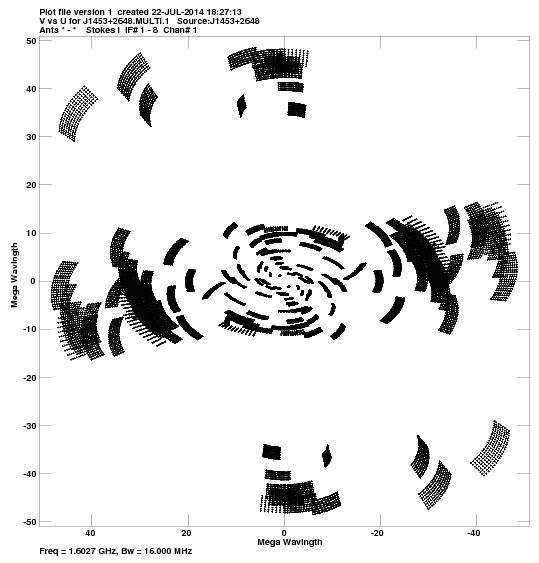
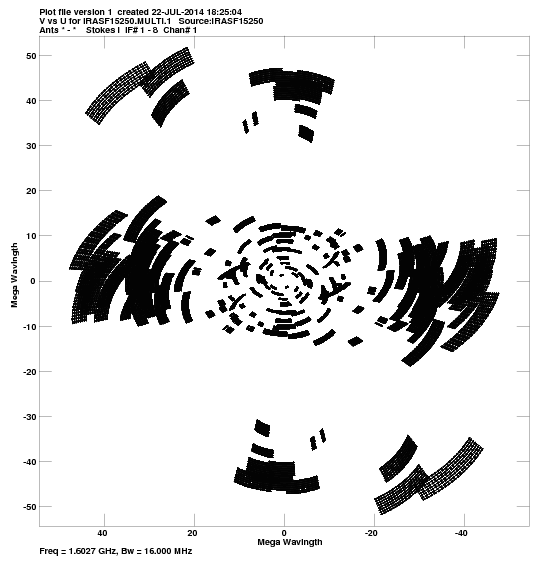
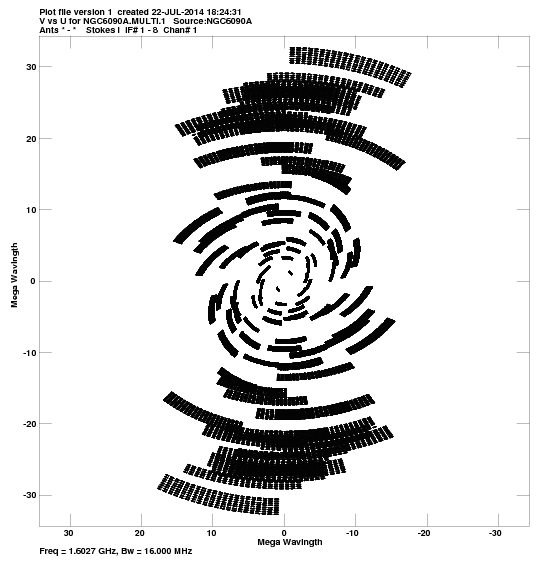
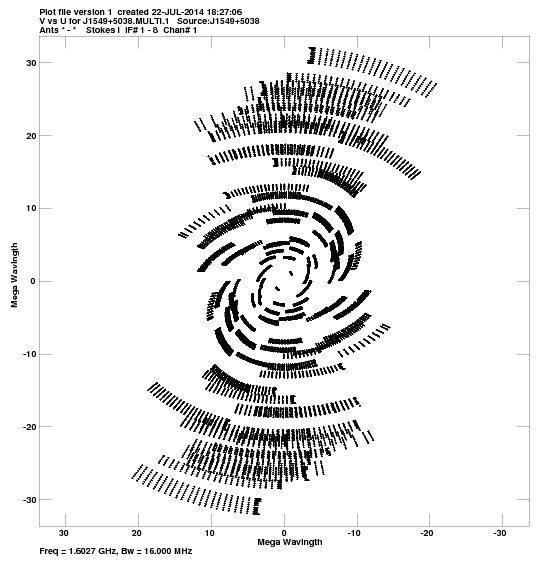
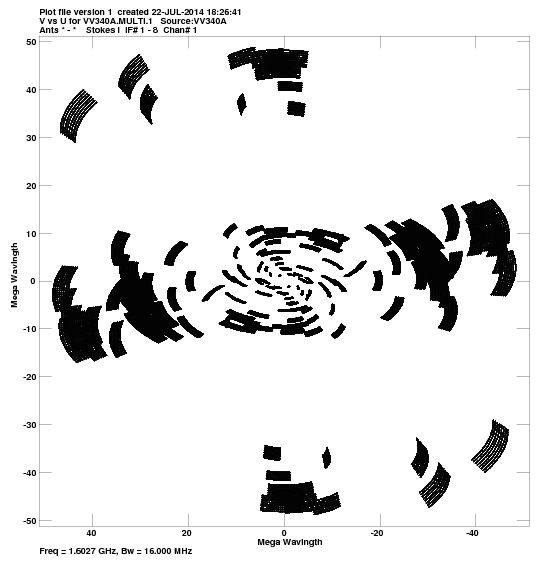
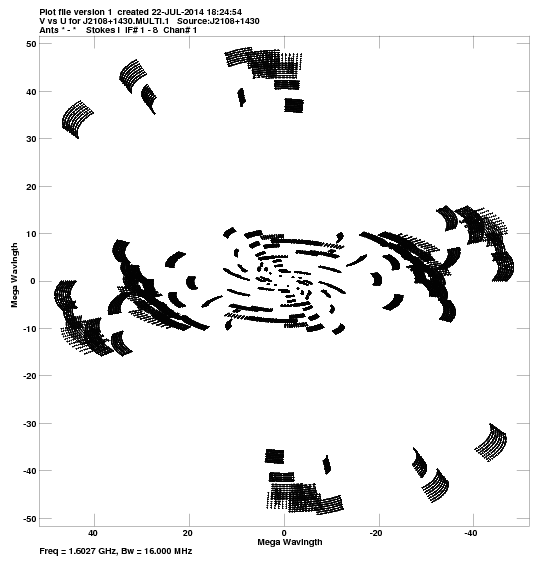
u,v coverage for:
CGCG448:
pdf
, or
png
.
J1824+5651:
pdf
, or
png
.
J1102+2757:
pdf
, or
png
.
3C454.3:
pdf
, or
png
.
IRAS10565:
pdf
, or
png
.
J1522+3144:
pdf
, or
png
.
NGC6670A:
pdf
, or
png
.
J1453+2648:
pdf
, or
png
.
IRASF15250:
pdf
, or
png
.
NGC6090A:
pdf
, or
png
.
J1549+5038:
pdf
, or
png
.
VV340A:
pdf
, or
png
.
J2108+1430:
pdf
, or
png
.
Comments.
For each source, a plot of the u-v coverage.
Crude maps of sources:
CGCG448:
pdf
, or
FITS
.
J1824+5651:
pdf
, or
FITS
.
J1102+2757:
pdf
, or
FITS
.
3C454.3:
pdf
, or
FITS
.
IRAS10565:
pdf
, or
FITS
.
J1522+3144:
pdf
, or
FITS
.
NGC6670A:
pdf
, or
FITS
.
J1453+2648:
pdf
, or
FITS
.
IRASF15250:
pdf
, or
FITS
.
NGC6090A:
pdf
, or
FITS
.
J1549+5038:
pdf
, or
FITS
.
VV340A:
pdf
, or
FITS
.
J2108+1430:
pdf
, or
FITS
.
Comments.
For each source, a CLEAN map resulting from the automated fringing and self-cal iterations (or phase-referencing) in the pipeline script.