
EVN User Experiment Pipeline Feedback
Last updated: Tue Feb 23 16:59:33 CET 2016
mao@jive.eu
General Comments.
(
Brief data summary
and
scan listing
)
L band phase-referencing experiment, observed on 14 Jun 2015. Data rate was 1 Gbps (8 X 16 MHz subbands, dual polarization, two-bit sampling). The target source SN1970G was calibrated using the phase-reference source J1359+5544. 3C309.1 was the fringe finder.
12 stations scheduled, however only 10 stations recorded data.
The EVN reliability indicator (ERI) for this experiment was
ERI = 0.58 . ERI* = 0.64 .
The ERI* value takes into account that:
- Noto did not observe at all due to their L-band receiver not working
- Sardinia did not observe.
- T6 had invalid data from 2053 - 2118 (from feedback)
- WB IF2 invalid due to failure to create circular pols
The ERI value also takes into account the following losses that are outside the station's control:
- Onsala did not observe frp, 1700 - 2230 due to high wind
- Medicina IFs 1, 2, 8 are RFI-ridden
Plots of the autocorrelations
Comments.
Each scan plotted separately, all stations. Some RFI is present.
Plots of the uncalibrated amplitude and phase
against time
Comments.
Full-experiment for Ef-* baselines, no calibration applied. A 1.5 minute plot-averaging was used.
Plots of the uncalibrated amplitude and phase
against frequency channel
Comments.
Scalar averaged Ef-* baselines, each scan plotted separately. No calibration applied yet. TR IF6 and SV IF1 are low due to RFI effects.
The uncalibrated amplitude and phase of the crosshand
correlations against frequency channel
Comments.
Scalar averaged Ef-* baselines for LR, each scan plotted separately. No calibration applied yet.
TSYS against time
Comments.
TY1 table, each IF/pol on a separate plot.
Telescope sensitivities
from the a priori TSYS and Gain
curves (the square of this number gives the antenna noise (SEFD) in Jy - the
smaller the better).
Comments.
Gain amplitude from CL2 table.
Fringe-fit phase solutions
(including Parallactic
Angle correction).
Comments.
CL3 station phase solutions -- CL3 = CL2+SN2, thus also includes the initial amplitude/parallactic angle calibration from CL2 and the fringe solutions from SN2. TR has a lot of data flagged. You may wish to run fring again.
Fringe-fit delay solutions
Comments.
SN2 station delay solutions for the fringed sources, each IF/pol on a separate plot.
Fringe-fit rate solutions
Comments.
SN2 station rate solutions.
Telescope bandpasses
Comments.
Bandpass table 1. 3C309.1 was used for bandpass calibration. IF1 for T6 and BD are rife with RFI.
Calibrated amplitude and phase against time
(a
priori amplitude calibration and fringe-fit solutions applied).
Comments.
Full-experiment for Ef-* baselines, calibrated with CL3. A 1.5 minute plot-averaging was used.
Calibrated amplitude and phase against frequency
channel
Comments.
Ef-* baselines calibrated with CL3 and BP1. The amp and phase plots self-scale, not necessarily going down to 0 in the case of the amps. Lots of RFI on IF 1, especially for the BD and T6.
Naturally weighted dirty map (not useful for bright sources)
produced before self-cal of:
SN1970G:
pdf
, or
FITS
.
J1359+5544: pdf (not available)
, or
FITS (not available)
.
3C309.1: pdf (not available)
, or
FITS (not available)
.
Comments.
Naturally weighted dirty maps of phase-referenced sources. No detection here. Try imaging a larger area.
Uniformly weighted dirty map (not useful for bright sources)
produced before self-cal of:
SN1970G:
pdf
, or
FITS
.
J1359+5544: pdf (not available)
, or
FITS (not available)
.
3C309.1: pdf (not available)
, or
FITS (not available)
.
Comments.
Uniformly weighted dirty maps of phase-referenced sources. As above
Phase corrections applied to a priori calibrated and
fringe-fitted data by self-calibration.
SN1970G
.
J1359+5544
.
3C309.1
.
Comments.
Plots of post-SPLIT tables SN1 for the sources that have been individually fringed.
Amplitude corrections applied to a priori calibrated and
fringe-fitted data by self-calibration.
SN1970G:
pdf
, or
text file
, or
statistical summary
.
J1359+5544:
pdf
, or
text file
, or
statistical summary
.
3C309.1:
pdf
, or
text file
, or
statistical summary
.
Comments.
As above, but for the post-SPLIT table SN2.
Telescope sensitivities
(the total AMP gain applied
during both a priori and self calibration; the square of this number gives the
antenna noise (SEFD) in Jy).
Comments.
CL4 gain-amp.
Residual closure phase (visibility closure phase with model closure phase subtracted) for:
SN1970G
.
J1359+5544
.
3C309.1
.
Comments.
Separate files per (fringed) source, showing closure phase plots for all the triangles. Only stokes=I shown.
Calibrated visibilities and the source model of:
SN1970G
.
J1359+5544
.
3C309.1
.
Comments.
For each (fringed) source, plots of amp/phase on Ef-* baselines, calibrated with (post-SPLIT) table CL3, with a model-line overplotted.
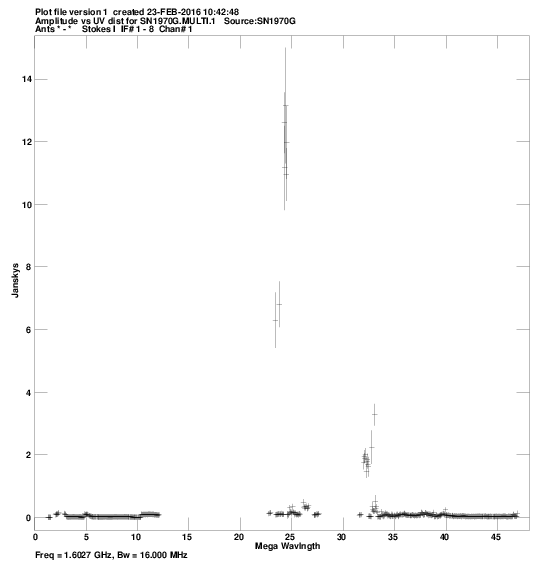
Calibrated visibilities against u,v distance for:
SN1970G:
pdf
, or
png
.
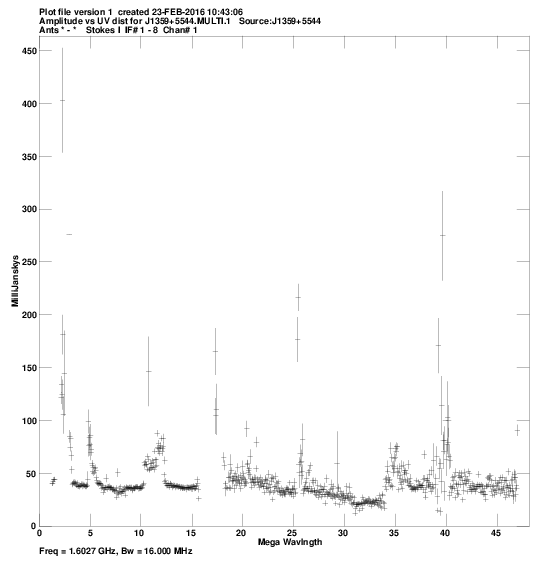
J1359+5544:
pdf
, or
png
.
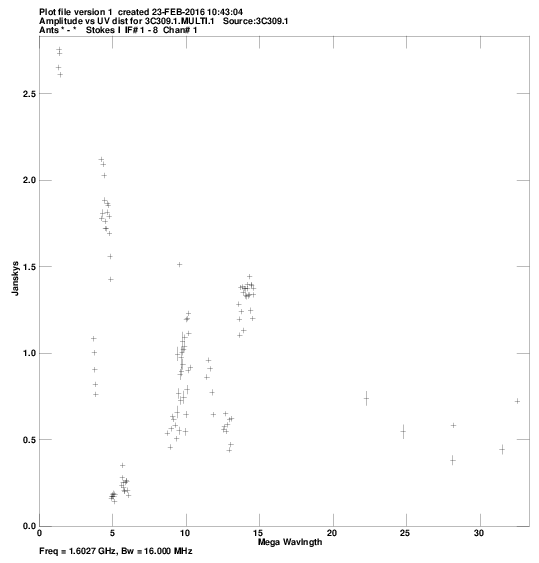
3C309.1:
pdf
, or
png
.
Comments.
For each source, a plot of amp vs. |uv| distance. Some bad data!
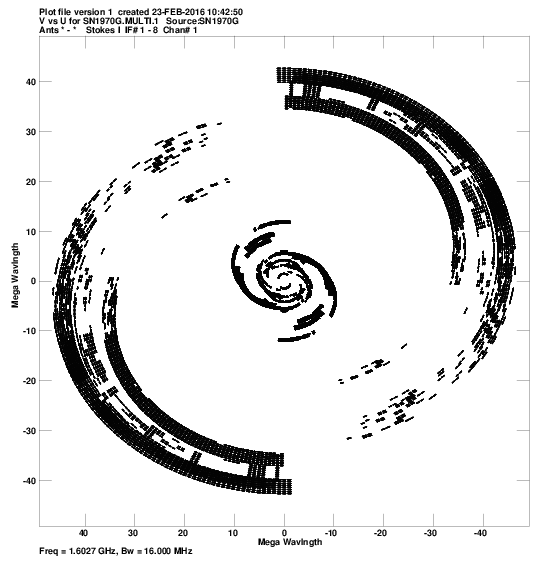
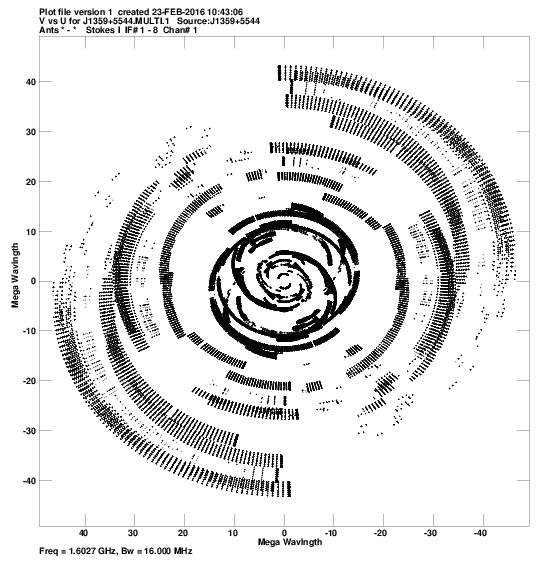
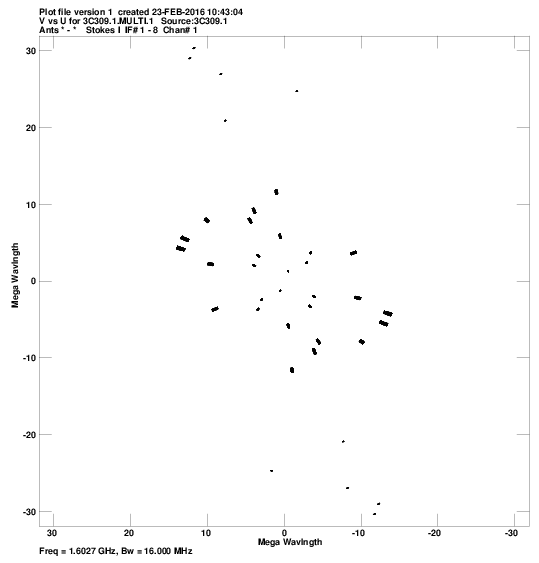
u,v coverage for:
SN1970G:
pdf
, or
png
.
J1359+5544:
pdf
, or
png
.
3C309.1:
pdf
, or
png
.
Comments.
For each source, a plot of the u-v coverage.
Crude maps of sources:
SN1970G:
pdf
, or
FITS
.
J1359+5544:
pdf
, or
FITS
.
3C309.1:
pdf
, or
FITS
.
Comments.
For each source, a CLEAN map resulting from the automated fringing and self-cal iterations (or phase-referencing) in the pipeline script. The target is not detected at this position. Try imaging a larger area.