
EVN User Experiment Pipeline Feedback
Last updated: Fri Mar 14 16:38:21 CET 2008
campbell@jive.nl
General Comments.
(
Brief data summary
and
scan listing
)
GC029 had 16 stations. There were 17 correlation passes; this pipelining corresponds to the phase center for J123700+620909, IF7. There were two polarizations and 256 frequency points, with 0.25s integrations. Considerably more information is included in the experiment's cover letter on the standard-plots portion of the EVN Archive. In the pipelining, the target sources were not fringed. The SOLINT was set automatically at a representative length of a reference-source scan in a phase-reference cycle (about 160s). Gb was used as the reference station.
The EVN reliability indicator (ERI) for this experiment was
ERI = 0.167 . ERI* = 0.167 .
The ERI and ERI* for the all passes was 0.167 The ERI pertains to only the EVN stations in the experiment. The losses include 60% for the lack of overlap arising from using the wrong schedule compared to the VLBAs, plus RFI or other lack-of-fringes in a subset if subbands cost 75% for Wb, 50% for Jb, and 25% for Mc.
Plots of the autocorrelations
Comments.
each scan plotted separately, all stations.
plots of the uncalibrated amplitude and phase
against time
Comments.
full-experiment for Gb-* baselines, no calibration applied. A 160s plot-averaging was used.
Plots of the uncalibrated amplitude and phase
against frequency channel
Comments.
scalar averaged Gb-* baselines, each scan plotted separately. No calibration applied yet.
The uncalibrated amplitude and phase of the crosshand
correlations against frequency channel
(not available)
Comments.
TSYS against time
Comments.
TY1 table, each IF/pol on a separate plot.
Telescope sensitivities
from the a priori TSYS and Gain
curves (the square of this number gives the antenna noise (SEFD) in Jy - the
smaller the better).
Comments.
gain amplitude from CL2 table.
Fringe-fit phase solutions
(including Parallactic
Angle correction).
Comments.
CL3 station phase solutions -- CL3 = CL2+SN2, thus also includes the initial amplitude/parallactic angle calibration from CL2 and the fringe solutions from SN2.
Fringe-fit delay solutions
Comments.
SN2 station delay solutions for the fringed sources, each IF/pol on a separate plot. For this pass, one lag corresponds to 1/16 microsecond of delay.
Fringe-fit rate solutions
Comments.
SN2 station rate solutions.
Telescope bandpasses
Comments.
bandpass table 1. J0927+3902 and 3C345 were used for bandpass calibration.
Calibrated amplitude and phase against time
(a
priori amplitude calibration and fringe-fit solutions applied).
Comments.
full-experiment for Gb-* baselines, calibrated with CL3. The 160s plot-averaging still applied.
Calibrated amplitude and phase against frequency
channel
Comments.
Gb-* baselines calibrated with CL3 and BP1. The amp and phase plots self-scale, not necessarily going down to 0 in the case of the amps.
Naturally weighted dirty map (not useful for bright sources)
produced before self-cal of:
J0927+3902: pdf (not available)
, or
FITS (not available)
.
3C345: pdf (not available)
, or
FITS (not available)
.
J1241+602: pdf (not available)
, or
FITS (not available)
.
J1234+619: pdf (not available)
, or
FITS (not available)
.
Comments.
Uniformly weighted dirty map (not useful for bright sources)
produced before self-cal of:
J0927+3902: pdf (not available)
, or
FITS (not available)
.
3C345: pdf (not available)
, or
FITS (not available)
.
J1241+602: pdf (not available)
, or
FITS (not available)
.
J1234+619: pdf (not available)
, or
FITS (not available)
.
Comments.
Phase corrections applied to a priori calibrated and
fringe-fitted data by self-calibration.
J0927+3902
.
3C345
.
J1241+602
.
J1234+619
.
Comments.
Plots of post-SPLIT tables SN1 for the sources that have been individually fringed.
Amplitude corrections applied to a priori calibrated and
fringe-fitted data by self-calibration.
J0927+3902:
pdf
, or
text file
, or
statistical summary
.
3C345:
pdf
, or
text file
, or
statistical summary
.
J1241+602:
pdf
, or
text file
, or
statistical summary
.
J1234+619:
pdf
, or
text file
, or
statistical summary
.
Comments.
As above, but for the post-SPLIT table SN2.
Telescope sensitivities
(the total AMP gain applied
during both a priori and self calibration; the square of this number gives the
antenna noise (SEFD) in Jy).
Comments.
CL4 gain-amp.
Residual closure phase (visibility closure phase with model closure phase subtracted) for:
J0927+3902
.
3C345
.
J1241+602
.
J1234+619
.
Comments.
Separate files per (fringed) source, showing closure phase plots for all the triangles (not just Gb-*-*). Only stokes=I shown.
Calibrated visibilities and the source model of:
J0927+3902
.
3C345
.
J1241+602
.
J1234+619
.
Comments.
For each (fringed) source, plots of amp/phase on Gb-* baselines, calibrated with (post-SPLIT) table CL3, with a model-line overplotted.
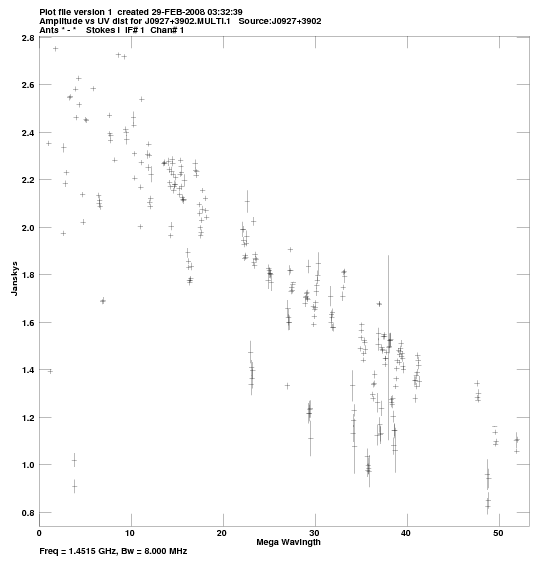
Calibrated visibilities against u,v distance for:
J0927+3902:
pdf
, or
png
.
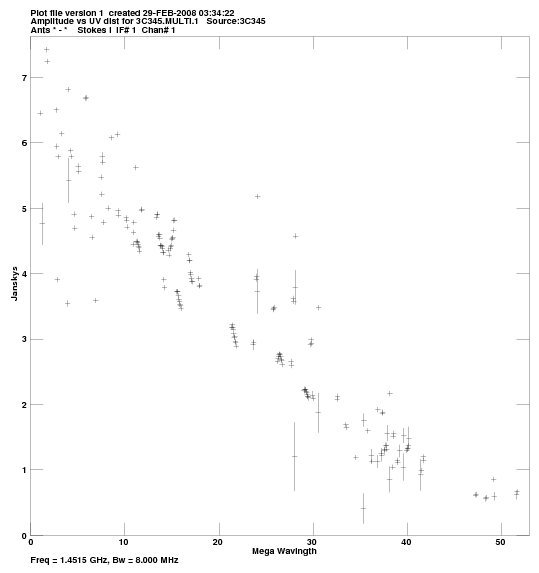
3C345:
pdf
, or
png
.
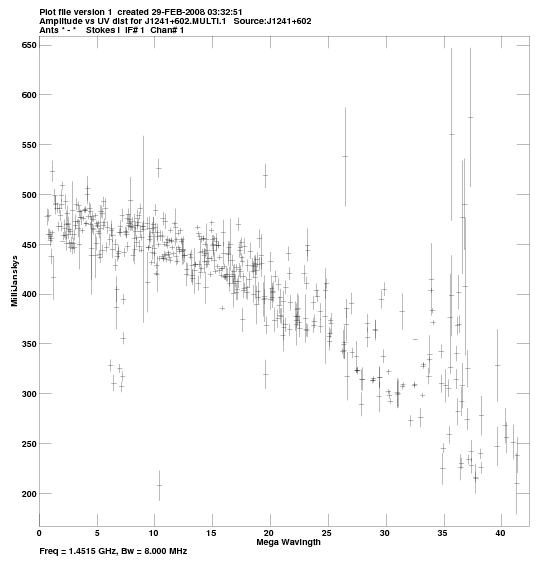
J1241+602:
pdf
, or
png
.
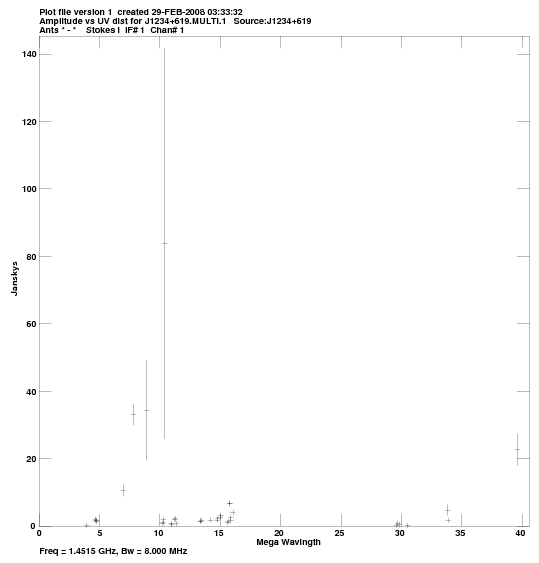
J1234+619:
pdf
, or
png
.
Comments.
For each source, a plot of amp vs. |uv| distance.
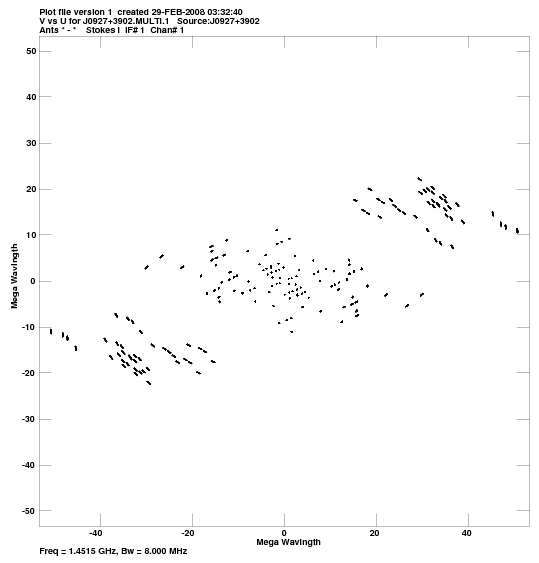
u,v coverage for:
J0927+3902:
pdf
, or
png
.
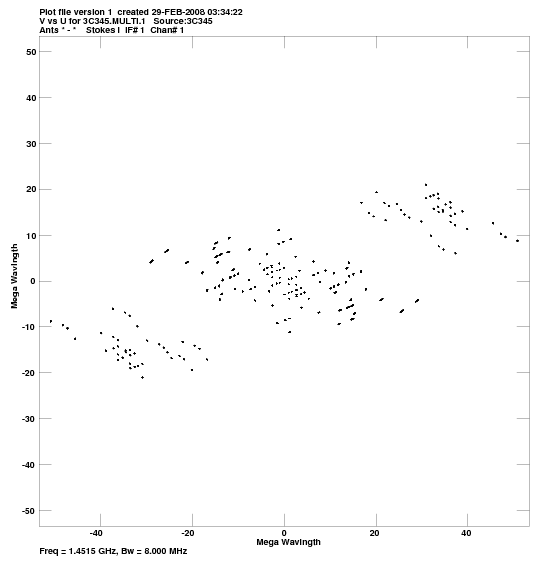
3C345:
pdf
, or
png
.
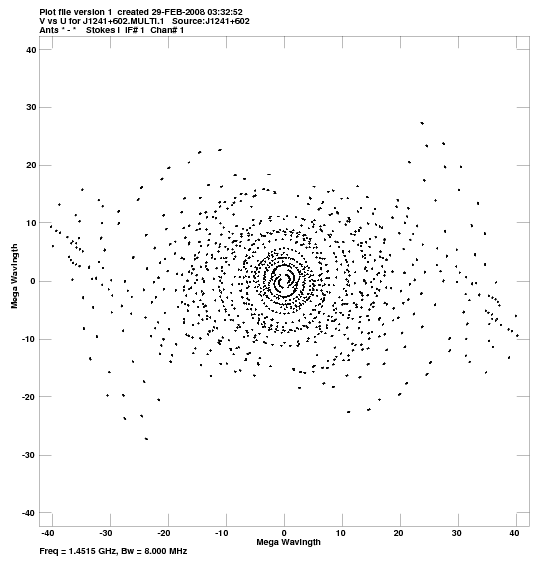
J1241+602:
pdf
, or
png
.
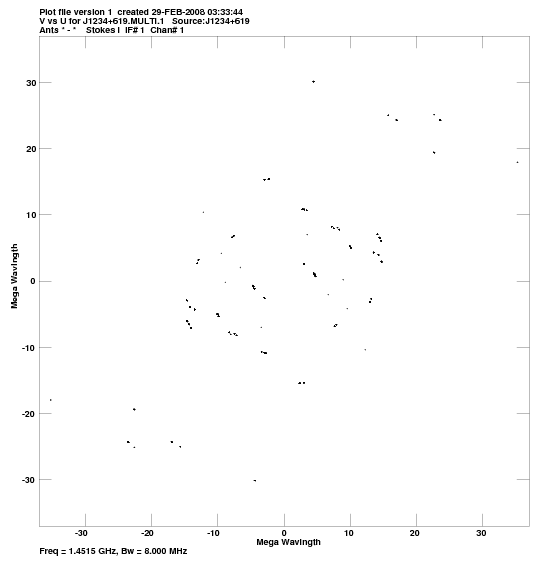
J1234+619:
pdf
, or
png
.
Comments.
For each source, a plot of the u-v coverage.
Crude maps of sources:
J0927+3902:
pdf
, or
FITS
.
3C345:
pdf
, or
FITS
.
J1241+602:
pdf
, or
FITS
.
J1234+619:
pdf
, or
FITS
.
Comments.
For each source, a CLEAN map resulting from the automated fringing and self-cal iterations in the pipeline script.