
EVN User Experiment Pipeline Feedback
Last updated: Fri Jul 27 01:39:04 CEST 2012
pidopryhora@jive.nl
General Comments.
(
Brief data summary
and
scan listing
)
N12L2 had 13 stations (including Hd and Hx - Hh with two different DBBCs and excluding Tr that cancelled its participation before the experiment and Ir that participated in the ftp-tests), 16 x 8 MHz IFs, 4 polarizations, and used 16 frequency points per IF/pol, with 2s integrations. The SOLINT was set at 5.0 min. Ef was used as the reference station. The experiment had no phase-referencing part. The targets, fringe-finders and bandpass calibrators were '0528+134', 'DA193', '4C39.25', and 'J1043+2408'.
The EVN reliability indicator (ERI) for this experiment was
ERI = 0.990 . ERI* = 0.990 .
Tr (did not observe, stopped for repairs) and Ir (participated in the ftp-tests) are not included in the ERI calculation. The only other clear loss was one BBC of Nt (Lcp of sb4-5).
Plots of the autocorrelations
Comments.
Each scan plotted separately, all stations.
plots of the uncalibrated amplitude and phase
against time
Comments.
Full-experiment for Ef-* baselines, no calibration applied. A 2-minute plot-averaging was used.
Plots of the uncalibrated amplitude and phase
against frequency channel
Comments.
Scalar averaged Ef-* baselines, each scan plotted separately. No calibration applied yet.
The uncalibrated amplitude and phase of the crosshand
correlations against frequency channel
Comments.
TSYS against time
Comments.
TY1 table, each IF/pol on a separate plot.
Telescope sensitivities
from the a priori TSYS and Gain
curves (the square of this number gives the antenna noise (SEFD) in Jy - the
smaller the better).
Comments.
Gain amplitude from CL2 table.
Fringe-fit phase solutions
(including Parallactic
Angle correction).
Comments.
FRING_PHAS CL3 station phase solutions -- CL3 = CL2+SN2, thus also includes the initial amplitude/parallactic angle calibration from CL2 and the fringe solutions from SN2.
Fringe-fit delay solutions
Comments.
SN2 station delay solutions for the fringed sources, each IF/pol on a separate plot.
Fringe-fit rate solutions
Comments.
SN2 station rate solutions.
Telescope bandpasses
Comments.
Bandpass table 1.
Calibrated amplitude and phase against time
(a
priori amplitude calibration and fringe-fit solutions applied).
Comments.
Full-experiment for Ef-* baselines, calibrated with CL3. The 2-min plot-averaging still applied.
Calibrated amplitude and phase against frequency
channel
Comments.
Ef-* baselines calibrated with CL3 and BP1. The amp and phase plots self-scale, not necessarily going down to 0 in the case of the amps.
Naturally weighted dirty map (not useful for bright sources)
produced before self-cal of:
J1043+2408: pdf (not available)
, or
FITS (not available)
.
4C39.25: pdf (not available)
, or
FITS (not available)
.
0528+134: pdf (not available)
, or
FITS (not available)
.
DA193: pdf (not available)
, or
FITS (not available)
.
Comments.
Uniformly weighted dirty map (not useful for bright sources)
produced before self-cal of:
J1043+2408: pdf (not available)
, or
FITS (not available)
.
4C39.25: pdf (not available)
, or
FITS (not available)
.
0528+134: pdf (not available)
, or
FITS (not available)
.
DA193: pdf (not available)
, or
FITS (not available)
.
Comments.
Phase corrections applied to a priori calibrated and
fringe-fitted data by self-calibration.
J1043+2408
.
4C39.25
.
0528+134
.
DA193
.
Comments.
Plots of post-SPLIT tables SN1 for the sources.
Amplitude corrections applied to a priori calibrated and
fringe-fitted data by self-calibration.
J1043+2408:
pdf
, or
text file
, or
statistical summary
.
4C39.25:
pdf
, or
text file
, or
statistical summary
.
0528+134:
pdf
, or
text file
, or
statistical summary
.
DA193:
pdf
, or
text file
, or
statistical summary
.
Comments.
As above, but for the post-SPLIT table SN2.
Telescope sensitivities
(the total AMP gain applied
during both a priori and self calibration; the square of this number gives the
antenna noise (SEFD) in Jy).
Comments.
CL4 gain-amp.
Residual closure phase (visibility closure phase with model closure phase subtracted) for:
J1043+2408
.
4C39.25
.
0528+134
.
DA193
.
Comments.
Separate files per (fringed) source, showing closure phase plots for all the triangles (not just Ef-*-*). Only stokes=I shown.
Calibrated visibilities and the source model of:
J1043+2408
.
4C39.25
.
0528+134
.
DA193
.
Comments.
For each (fringed) source, plots of amp/phase on Ef-* baselines, calibrated with (post-SPLIT) table CL3, with a model-line overplotted.
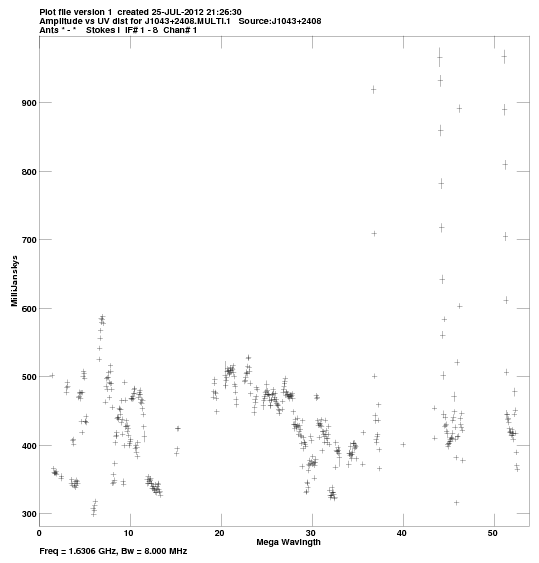
Calibrated visibilities against u,v distance for:
J1043+2408:
pdf
, or
png
.
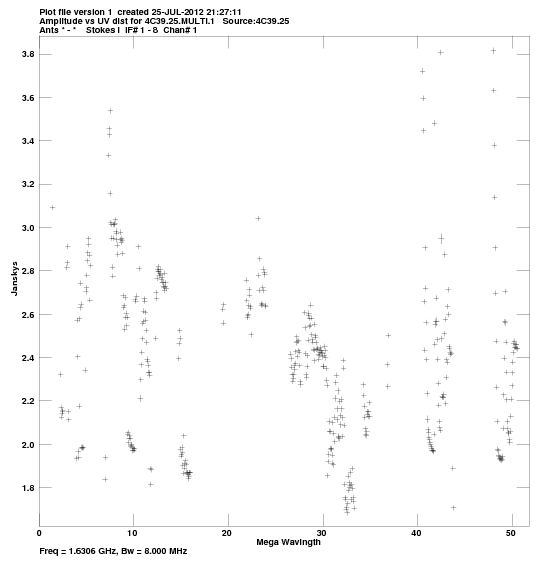
4C39.25:
pdf
, or
png
.
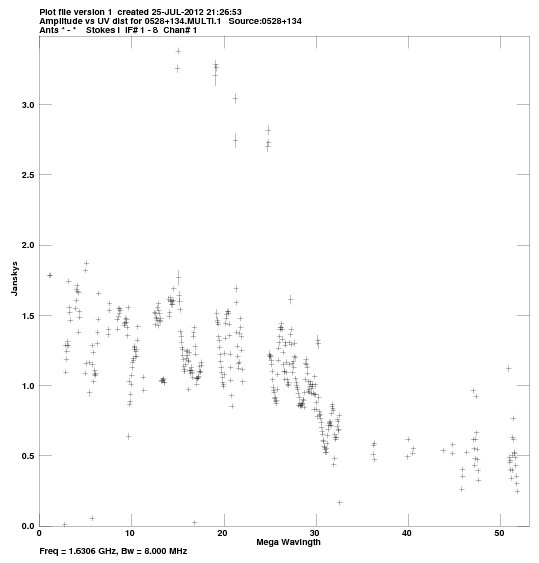
0528+134:
pdf
, or
png
.
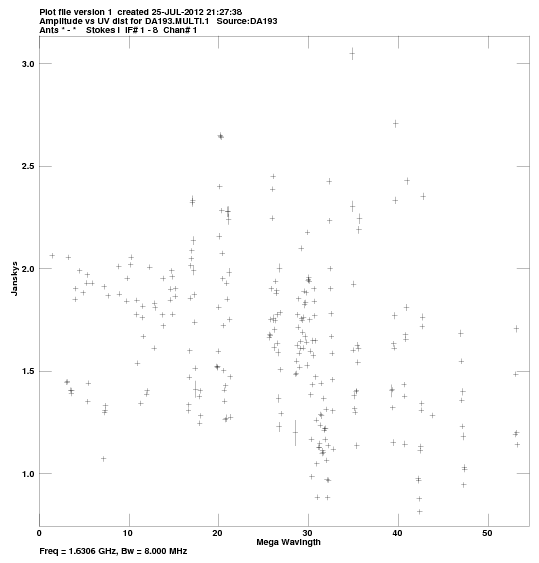
DA193:
pdf
, or
png
.
Comments.
For each source, a plot of amp vs. |uv| distance.
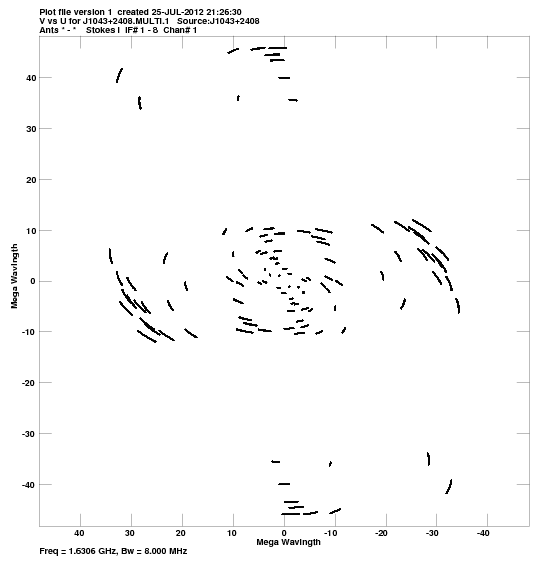
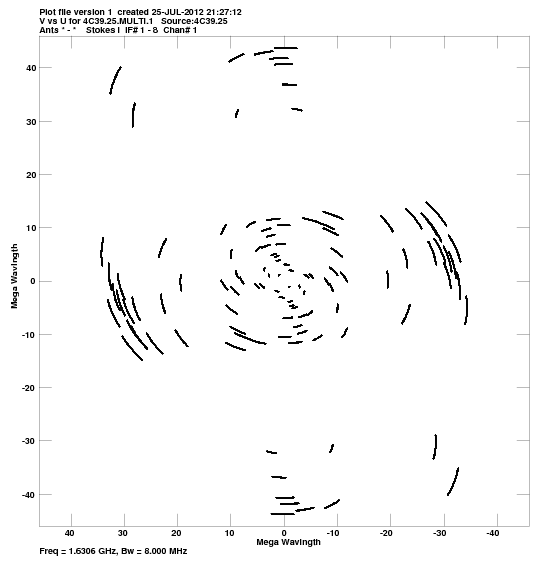
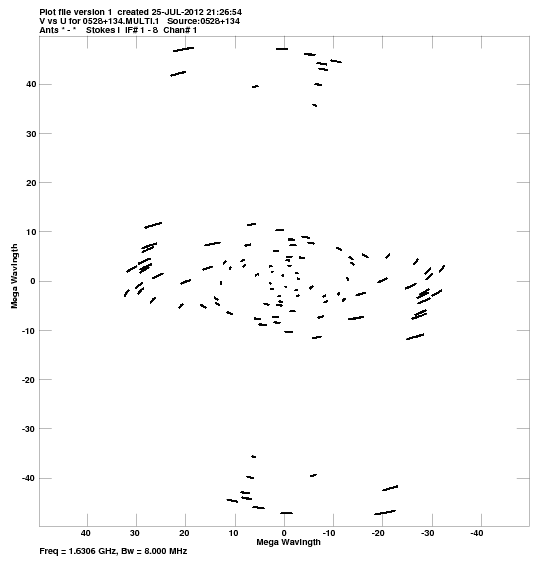
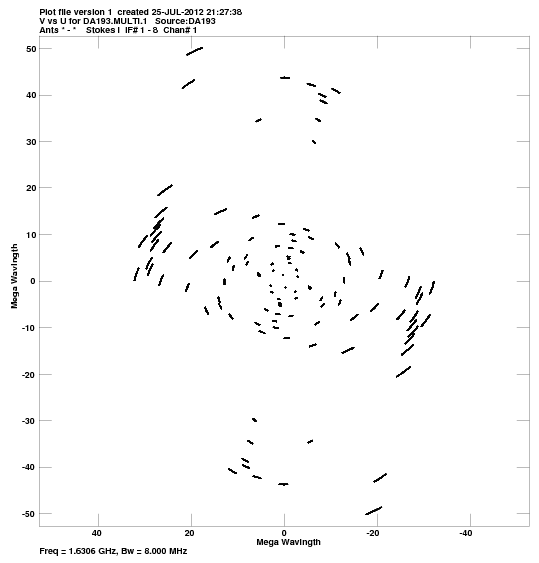
u,v coverage for:
J1043+2408:
pdf
, or
png
.
4C39.25:
pdf
, or
png
.
0528+134:
pdf
, or
png
.
DA193:
pdf
, or
png
.
Comments.
For each source, a plot of the u-v coverage.
Crude maps of sources:
J1043+2408:
pdf
, or
FITS
.
4C39.25:
pdf
, or
FITS
.
0528+134:
pdf
, or
FITS
.
DA193:
pdf
, or
FITS
.
Comments.
For each source, a CLEAN map resulting from the automated fringing and self-cal iterations (or phase-referencing) in the pipeline script.