
EVN User Experiment Pipeline Feedback
Last updated: wo okt 6 12:01:24 CEST 2021
zparagi@jive.eu
General Comments.
(
Brief data summary
and
scan listing
)
RG012H - ToO monitoring, 4th epoch. L-band EVN phase-referencing experiment, observed on 27 September 2021. The data rate was 1024 Mbps (4 x 32 MHz subbands, in both LCP and RCP polarizations, two-bit sampling). The target source RS Oph and the check source VLASS1 were calibrated using the phase-reference source J1745-0753. 1749+096 and 3C454.3 were fringe-finders.
Plots of the autocorrelations
Comments.
Each scan plotted separately, all stations. Most European stations show strong RFI near 1600 MHz (unrelated to Iridium). This was seen (somewhat weaker) in the previous epoch as well. Source not clear. Amplitudes & sensitivity in AIPS IF1 will be affected.
Plots of the uncalibrated amplitude and phase
against time
Comments.
Full-experiment for Ef-** baselines, no calibration applied. A 1.5 minute plot-averaging was used.
Plots of the uncalibrated amplitude and phase
against frequency channel
Comments.
Scalar averaged Ef-** baselines, each scan plotted separately. No calibration applied yet.
The uncalibrated amplitude and phase of the crosshand
correlations against frequency channel
Comments.
TSYS against time
Comments.
TY1 table, each IF/pol on a separate plot.
Telescope sensitivities
from the a priori TSYS and Gain
curves (the square of this number gives the antenna noise (SEFD) in Jy - the
smaller the better).
Comments.
Gain amplitude from CL2 table. Used nominals for WB, and did some clipping in Tsys for others.
Fringe-fit phase solutions
(including Parallactic
Angle correction).
Comments.
CL3 station phase solutions -- CL3 = CL2+SN2, thus also includes the initial amplitude/parallactic angle calibration from CL2 and the fringe solutions from SN2.
Fringe-fit delay solutions
Comments.
SN2 station delay solutions for the fringed sources, each IF/pol on a separate plot. Fringes go away for Onsala halway through the
experiment. There are fringes to Westerbork but the data seem to be useless. For Hartebesthoek there are no fringes in the pipeline, but there were some -apparently- good solutions with SNR 4-5 that were not coming through. Combining IFs during fringe-fitting will likely restore all data.
Fringe-fit rate solutions
Comments.
SN2 station rate solutions.
Telescope bandpasses
Comments.
Bandpass table 1.
Calibrated amplitude and phase against time
(a
priori amplitude calibration and fringe-fit solutions applied).
Comments.
Full-experiment for Ef-** baselines, calibrated with CL3. The 1.5-min plot-averaging still applied.
Calibrated amplitude and phase against frequency
channel
Comments.
Ef-** baselines calibrated with CL3 and BP1. The amp and phase plots self-scale, not necessarily going down to 0 in the case of the amps.
Naturally weighted dirty map (not useful for bright sources)
produced before self-cal of:
J1745-0753: pdf (not available)
, or
FITS (not available)
.
1749+096: pdf (not available)
, or
FITS (not available)
.
3C454.3: pdf (not available)
, or
FITS (not available)
.
RSOPH:
pdf
, or
FITS
.
VLASS1:
pdf
, or
FITS
.
Comments.
Uniformly weighted dirty map (not useful for bright sources)
produced before self-cal of:
J1745-0753: pdf (not available)
, or
FITS (not available)
.
1749+096: pdf (not available)
, or
FITS (not available)
.
3C454.3: pdf (not available)
, or
FITS (not available)
.
RSOPH:
pdf
, or
FITS
.
VLASS1:
pdf
, or
FITS
.
Comments.
Phase corrections applied to a priori calibrated and
fringe-fitted data by self-calibration.
J1745-0753
.
1749+096
.
3C454.3
.
RSOPH (not available)
.
VLASS1 (not available)
.
Comments.
Plots of post-SPLIT tables SN1 for the sources that have been individually fringed.
Amplitude corrections applied to a priori calibrated and
fringe-fitted data by self-calibration.
J1745-0753:
pdf
, or
text file
, or
statistical summary
.
1749+096:
pdf
, or
text file
, or
statistical summary
.
3C454.3:
pdf
, or
text file
, or
statistical summary
.
RSOPH: pdf (not available)
, or
text file (not available)
, or
statistical summary (not available)
.
VLASS1: pdf (not available)
, or
text file (not available)
, or
statistical summary (not available)
.
Comments.
As above, but for the post-SPLIT table SN2.
Telescope sensitivities
(the total AMP gain applied
during both a priori and self calibration; the square of this number gives the
antenna noise (SEFD) in Jy).
Comments.
CL4 gain-amp.
Residual closure phase (visibility closure phase with model closure phase subtracted) for:
J1745-0753
.
1749+096
.
3C454.3
.
RSOPH (not available)
.
VLASS1 (not available)
.
Comments.
Separate files per (fringed) source, showing closure phase plots for all the triangles. Only stokes=I shown.
Calibrated visibilities and the source model of:
J1745-0753
.
1749+096
.
3C454.3
.
RSOPH (not available)
.
VLASS1 (not available)
.
Comments.
For each (fringed) source, plots of amp/phase on Ef-** baselines, calibrated with (post-SPLIT) table CL3, with a model-line overplotted.
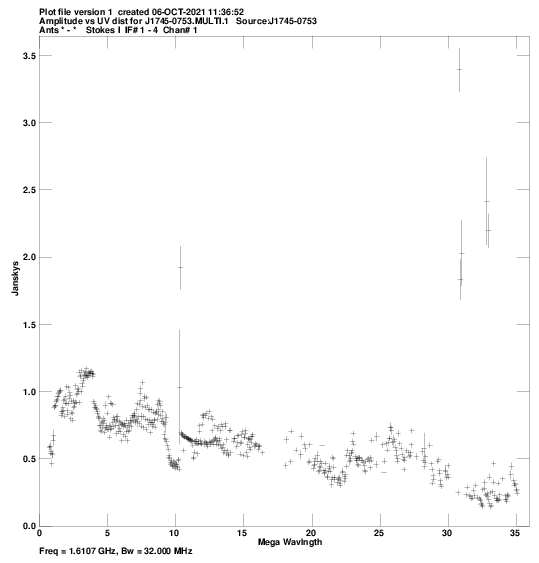
Calibrated visibilities against u,v distance for:
J1745-0753:
pdf
, or
png
.
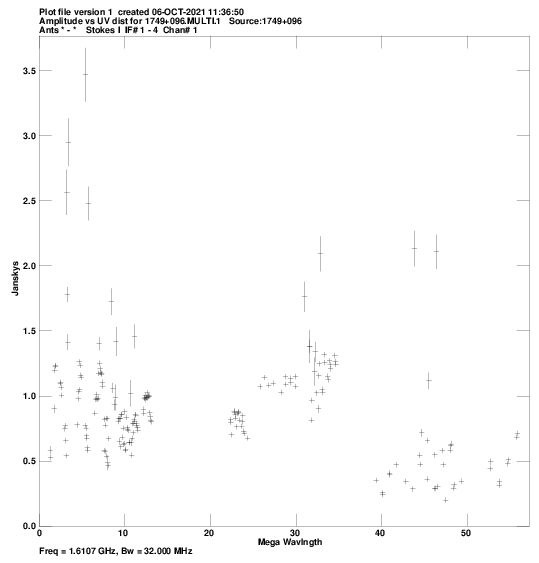
1749+096:
pdf
, or
png
.
3C454.3:
pdf
, or
png
.
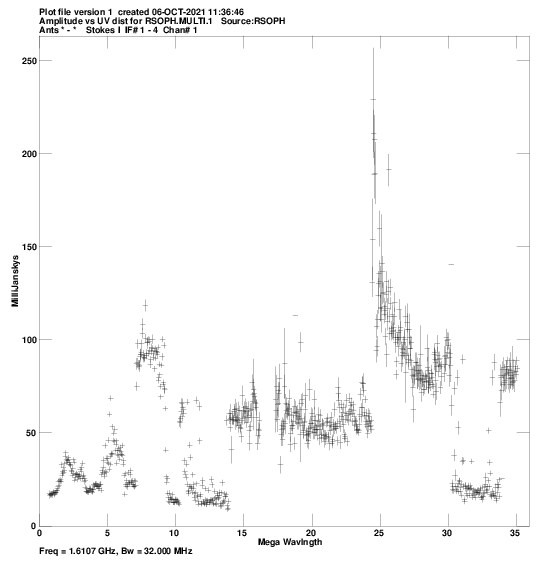
RSOPH:
pdf
, or
png
.
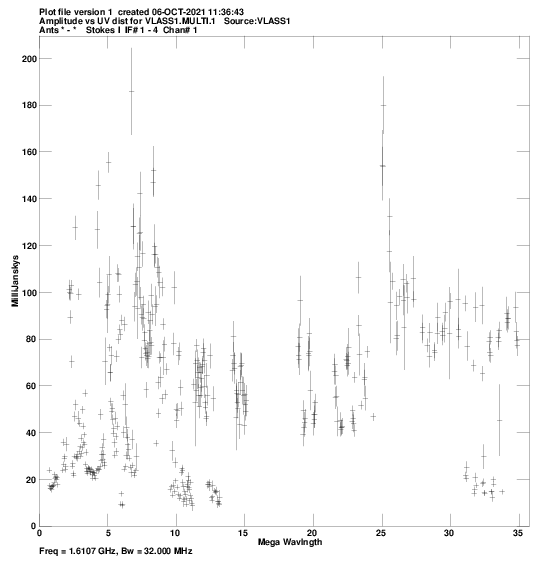
VLASS1:
pdf
, or
png
.
Comments.
For each source, a plot of amp vs. |uv| distance.
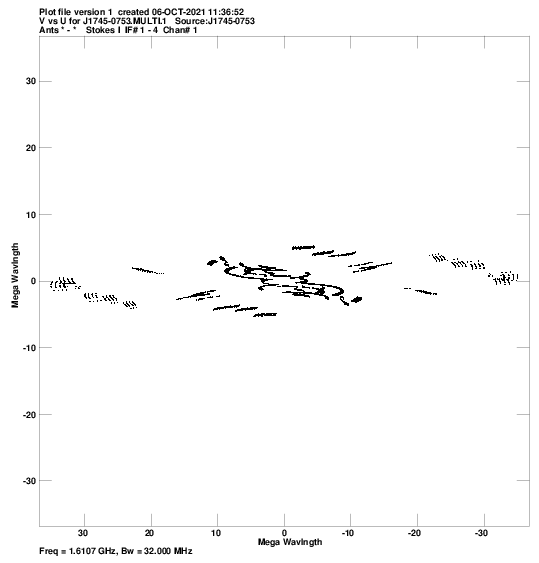
u,v coverage for:
J1745-0753:
pdf
, or
png
.
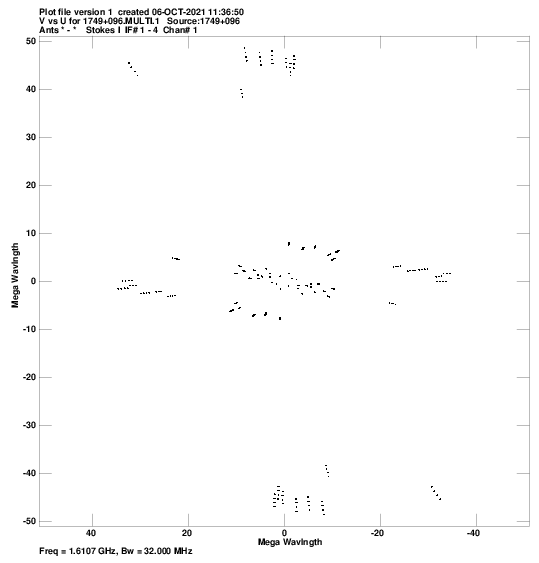
1749+096:
pdf
, or
png
.
3C454.3:
pdf
, or
png
.
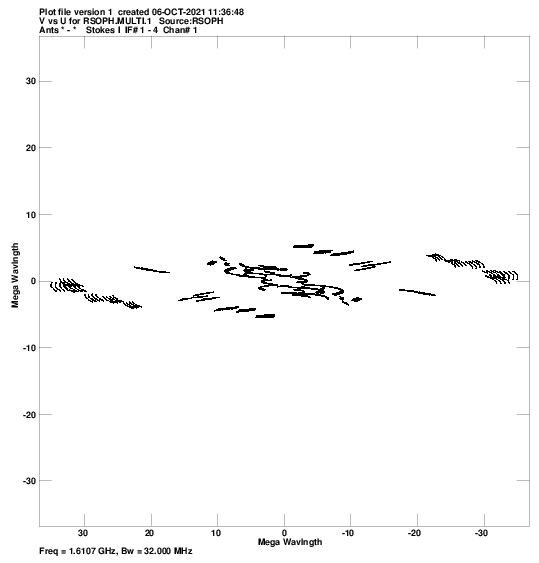
RSOPH:
pdf
, or
png
.
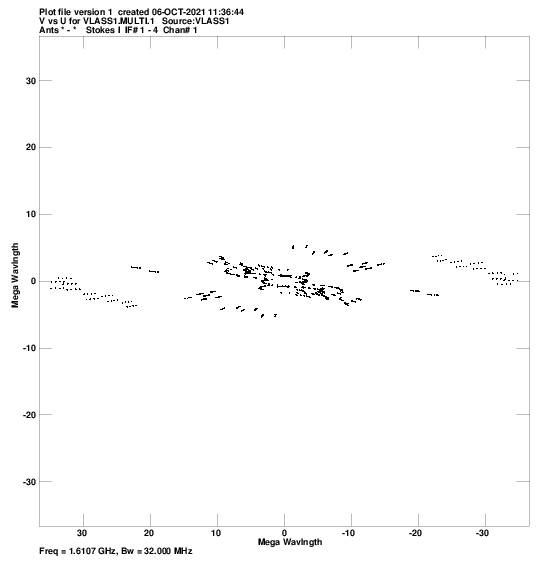
VLASS1:
pdf
, or
png
.
Comments.
For each source, a plot of the u-v coverage.
Crude maps of sources:
J1745-0753:
pdf
, or
FITS
.
1749+096:
pdf
, or
FITS
.
3C454.3:
pdf
, or
FITS
.
RSOPH:
pdf
, or
FITS
.
VLASS1:
pdf
, or
FITS
.
Comments.
For each source, a CLEAN map resulting from the automated fringing and self-cal iterations in the pipeline script.