
EVN User Experiment Pipeline Feedback
Last updated: Wed Aug 30 09:00:25 CEST 2006
campbell@jive.nl
General Comments.
(
Brief data summary
and
scan listing
)
EA035C had 8 stations, 2 0.5MHz IFs, and four polarizations. There were 512 frequency points per IF/pol, and integration times were 4s. The two IFs were correlated in separate passes, which produced separate FITS files. This pipelining (ea035c_2*) corresponds to the IF at DC-edge 1667.22. Considerably more information is included in the experiment's cover letter on the standard-plots portion of the EVN Archive. In the pipelining, all sources were fringed (no phase-referencing), but there were very few fringe solutions for the target maser source (pipeline currently does not include any special spectral-line source considerations). The SOLINT was 2.75 minutes (one-quarter of the typical 11-minute scan length). Because of Ef's problem with the warming receiver, Wb was used as the reference station, with Ef used as the alternate to cover the period early in the experiment when the sources were outside Wb's telescope limits.
The EVN reliability indicator (ERI) for this experiment was
ERI = 0.813 . ERI* = 0.813 .
The ERI was 0.813. The losses include Ef completely missing about 1hr at the end because of the receiver's loss of cooling, and Mc starting the experiment about 2hr late. Also, the loss of LCP for On makes it count as only half a station for the whole 12hr.
Plots of the autocorrelations
Comments.
116 pages, each scan plotted separately, all stations (~2p/scan).
plots of the uncalibrated amplitude and phase
against time
Comments.
4 pages, full-experiment for Wb-* baselines, no calibration applied. A 2.75 minute plot-averaging was used.
Plots of the uncalibrated amplitude and phase
against frequency channel
Comments.
106 pages, scalar averaged Wb-* baselines, each scan plotted separately. No calibration applied yet.
The uncalibrated amplitude and phase of the crosshand
correlations against frequency channel
Comments.
53 pages, scalar averaged Wb-* baselines for the polarization product LR (1p/scan).
TSYS against time
Comments.
2 pages, TY1 table, each IF/pol on a separate plot.
Telescope sensitivities
from the a priori TSYS and Gain
curves (the square of this number gives the antenna noise (SEFD) in Jy - the
smaller the better).
Comments.
2 pages, gain amplitude from CL2 table.
Fringe-fit phase solutions
(including Parallactic
Angle correction).
Comments.
2 pages, CL3 station phase solutions -- CL3 = CL2+SN2, thus also includes the initial amplitude/parallactic angle calibration from CL2 and the fringe solutions from SN2. The sudden jump in the phase-slope for Ur is also seen in the standard (old-style) plots.
Fringe-fit delay solutions
Comments.
2 pages, SN2 station delay solutions for the fringed sources, each IF/pol on a separate plot. LCP to On gets essentially no fringe solutions anywhere. For this experiment, one lag corresponds to 1 microsecond of delay.
Fringe-fit rate solutions
Comments.
2 pages, SN2 station rate solutions.
Telescope bandpasses
Comments.
2 pages, bandpass table 1. Sources 3C273, 3C286, OQ208, 3C345, and 3C454.3 were used for bandpass calibration.
Calibrated amplitude and phase against time
(a
priori amplitude calibration and fringe-fit solutions applied).
Comments.
4 pages, full-experiment for Wb-* baselines, calibrated with CL3. The 2.75-min plot-averaging still applied. Following the fringing, essentially only the calibrator sources remain.
Calibrated amplitude and phase against frequency
channel
Comments.
24 pages; Wb-* baselines calibrated with CL3 and BP1. The amp and phase plots self-scale, not necessarily going down to 0 in the case of the amps.
Naturally weighted dirty map (not useful for bright sources)
produced before self-cal of:
3C286: pdf (not available)
, or
FITS (not available)
.
3C345: pdf (not available)
, or
FITS (not available)
.
OQ208: pdf (not available)
, or
FITS (not available)
.
3C273: pdf (not available)
, or
FITS (not available)
.
Comments.
Uniformly weighted dirty map (not useful for bright sources)
produced before self-cal of:
3C286: pdf (not available)
, or
FITS (not available)
.
3C345: pdf (not available)
, or
FITS (not available)
.
OQ208: pdf (not available)
, or
FITS (not available)
.
3C273: pdf (not available)
, or
FITS (not available)
.
Comments.
Phase corrections applied to a priori calibrated and
fringe-fitted data by self-calibration.
3C286
.
3C345
.
OQ208
.
3C273
.
Comments.
Plots of post-SPLIT tables SN1 for the sources 3C286, 3C273, 3C345, 3C454.3, and OQ208. These sources have between 1-3 scans each. 2 pages per source.
Amplitude corrections applied to a priori calibrated and
fringe-fitted data by self-calibration.
3C286:
pdf
, or
text file
, or
statistical summary
.
3C345:
pdf
, or
text file
, or
statistical summary
.
OQ208:
pdf
, or
text file
, or
statistical summary
.
3C273:
pdf
, or
text file
, or
statistical summary
.
Comments.
As above, but for the post-SPLIT table SN2.
Telescope sensitivities
(the total AMP gain applied
during both a priori and self calibration; the square of this number gives the
antenna noise (SEFD) in Jy).
Comments.
CL4 gain-amp. Ur LCP is notiecable down in senstitivity (also seen in the standard plots).
Residual closure phase (visibility closure phase with model closure phase subtracted) for:
3C286
.
3C345
.
OQ208
.
3C273
.
Comments.
Separate files per (fringed) source, showing closure phase plots for all the triangles (not just Wb-*-*). Only stokes=I shown. Between 10-12 pages per source.
Calibrated visibilities and the source model of:
3C286
.
3C345
.
OQ208
.
3C273
.
Comments.
For each (fringed) source, plots of amp/phase on Wb-* baselines, calibrated with (post-SPLIT) table CL3, with a model-line overplotted. 4 pages per source.
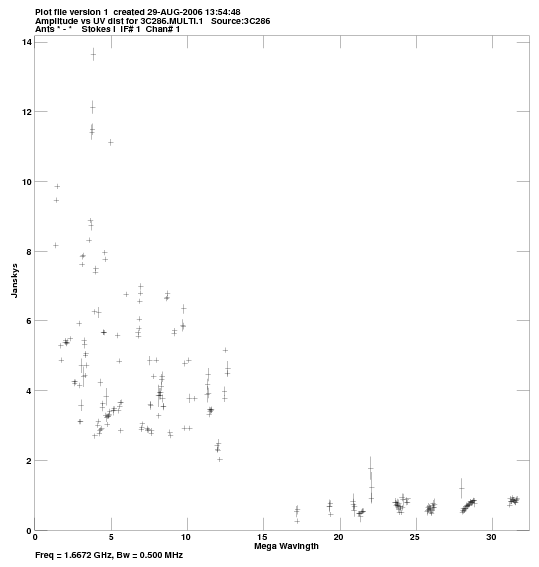
Calibrated visibilities against u,v distance for:
3C286:
pdf
, or
png
.
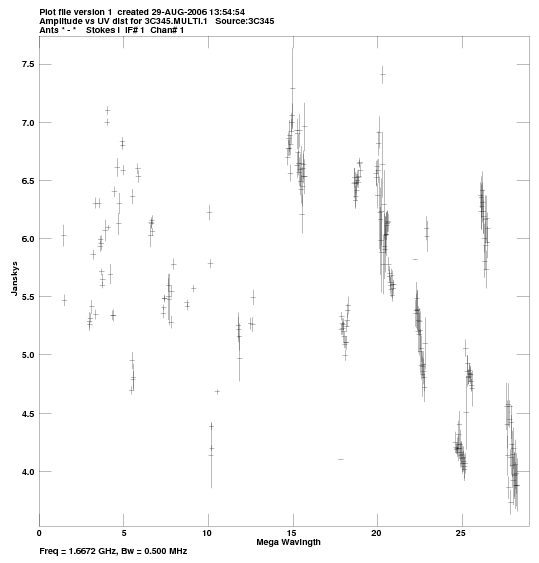
3C345:
pdf
, or
png
.
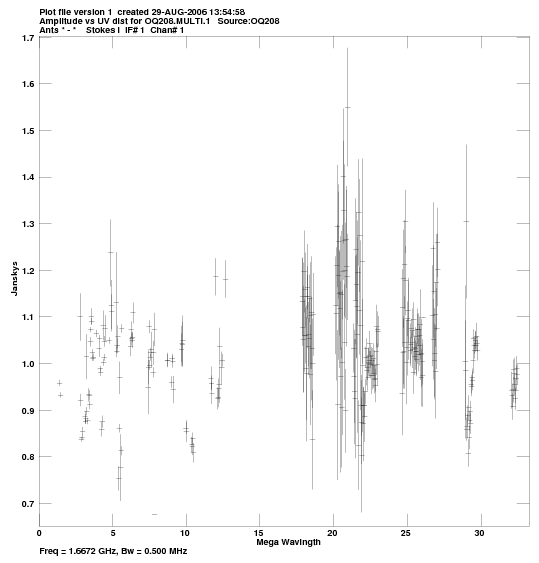
OQ208:
pdf
, or
png
.
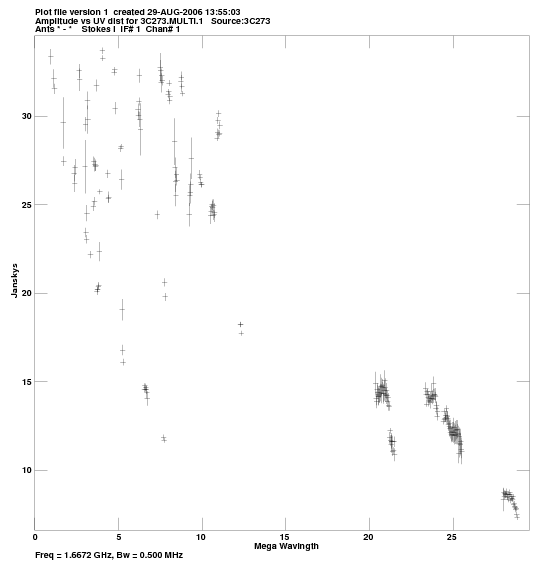
3C273:
pdf
, or
png
.
Comments.
For each (fringed) source, a plot of amp vs. |uv| distance.
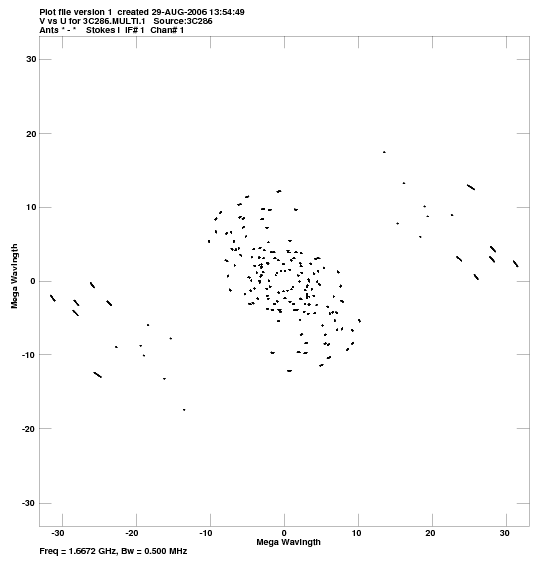
u,v coverage for:
3C286:
pdf
, or
png
.
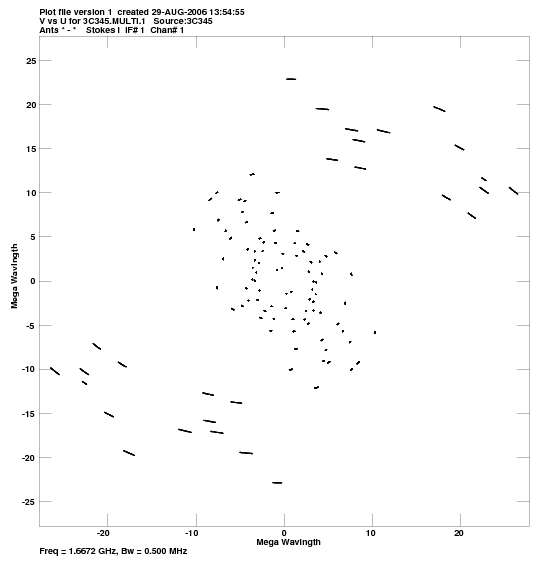
3C345:
pdf
, or
png
.
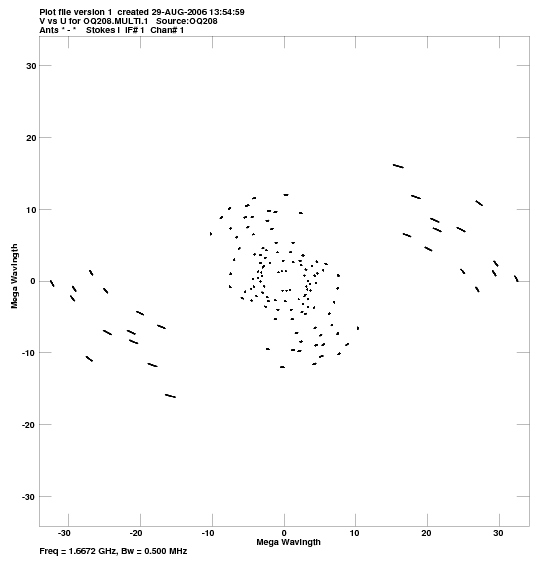
OQ208:
pdf
, or
png
.
3C273:
pdf
, or
png
.
Comments.
For each (fringed) source, a plot of the u-v coverage.
Crude maps of sources:
3C286:
pdf
, or
FITS
.
3C345:
pdf
, or
FITS
.
OQ208:
pdf
, or
FITS
.
3C273:
pdf
, or
FITS
.
Comments.
For each (fringed) source, a CLEAN map resulting from the automated fringing and self-cal iterations in the pipeline script. 3C454.3 failed during the automated mapping (it had only 1 scan).