
EVN User Experiment Pipeline Feedback
Last updated: Mon Oct 11 17:05:58 CEST 2010
campbell@jive.nl
General Comments.
(
Brief data summary
and
scan listing
)
EP064L had 11 stations (no Ar, but including Knockin as an extra MERLIN station included in the EVN correlation), 8 16 MHz IFs, two polarizations, and used 32 frequency points per IF/pol, with 2s integrations. Considerably more information is included in the experiment's cover letter on the standard-plots portion of the EVN Archive. In the pipelining, the target source was treated as a phase-referenced source and not directly fringed. The SOLINT was set automatically at a representative length of a reference-source scan in a phase-reference cycle (110s). Ef was used as the reference station.
The EVN reliability indicator (ERI) for this experiment was
ERI = 0.683 . ERI* = 0.683 .
The ERI was 0.683, with losses including Ar missing the session, Cm's formatter problem in the first ~half of the experiments (also affecting Kn), and Tr missing the first couple scans. The lower amplitude in Tr RCP channels was not counted against ERI (fringes were there, albeit with lower sensitivity), nor were Jb/Nt channels having essentially 0-fraction of high bits, as these were recovered reasonably successfully.
Plots of the autocorrelations
Comments.
Each scan plotted separately, all stations.
plots of the uncalibrated amplitude and phase
against time
Comments.
Full-experiment for Ef-* baselines, no calibration applied. A 1.8 minute plot-averaging was used.
Plots of the uncalibrated amplitude and phase
against frequency channel
Comments.
Scalar averaged Ef-* baselines, each scan plotted separately. No calibration applied yet.
The uncalibrated amplitude and phase of the crosshand
correlations against frequency channel
(not available)
Comments.
TSYS against time
Comments.
TY1 table, each IF/pol on a separate plot. As usual, Cm & Kn have 'dummy' Tsys values.
Telescope sensitivities
from the a priori TSYS and Gain
curves (the square of this number gives the antenna noise (SEFD) in Jy - the
smaller the better).
Comments.
Gain amplitude from CL2 table.
Fringe-fit phase solutions
(including Parallactic
Angle correction).
Comments.
CL3 station phase solutions -- CL3 = CL2+SN2, thus also includes the initial amplitude/parallactic angle calibration from CL2 and the fringe solutions from SN2.
Fringe-fit delay solutions
Comments.
SN2 station delay solutions for the fringed sources, each IF/pol on a separate plot.
Fringe-fit rate solutions
Comments.
SN2 station rate solutions.
Telescope bandpasses
Comments.
Bandpass table 1. J2330+3348 was used for bandpass calibration (Cm, Kn, Tr missed all the fringe-finder scans). For some reason, BPASS insisted on leaving Cm IF4 with a flat phase(frq) calibration, and put (the negative of) what appears should have been associated with Cm in everyone else. Different pypeline runs with adjustments to the reference station(s) and chflag file could not entirely remove this effect (which did not occur for EP064B & D with essentially the same observing set-up & pypeline control files).
Calibrated amplitude and phase against time
(a
priori amplitude calibration and fringe-fit solutions applied).
Comments.
Full-experiment for Ef-* baselines, calibrated with CL3. The 1.8-min plot-averaging still applied.
Calibrated amplitude and phase against frequency
channel
Comments.
Ef-* baselines calibrated with CL3 and BP1. The amp and phase plots self-scale, not necessarily going down to 0 in the case of the amps.
Naturally weighted dirty map (not useful for bright sources)
produced before self-cal of:
2134+004: pdf (not available)
, or
FITS (not available)
.
3C454.3: pdf (not available)
, or
FITS (not available)
.
IRAS2336:
pdf
, or
FITS
.
J2330+3348: pdf (not available)
, or
FITS (not available)
.
J2333+3901: pdf (not available)
, or
FITS (not available)
.
Comments.
Naturually weighted dirty map of the target.
Uniformly weighted dirty map (not useful for bright sources)
produced before self-cal of:
2134+004: pdf (not available)
, or
FITS (not available)
.
3C454.3: pdf (not available)
, or
FITS (not available)
.
IRAS2336:
pdf
, or
FITS
.
J2330+3348: pdf (not available)
, or
FITS (not available)
.
J2333+3901: pdf (not available)
, or
FITS (not available)
.
Comments.
Uniformly weighted dirty map of the target.
Phase corrections applied to a priori calibrated and
fringe-fitted data by self-calibration.
2134+004
.
3C454.3
.
IRAS2336 (not available)
.
J2330+3348
.
J2333+3901
.
Comments.
Plots of post-SPLIT tables SN1 for the sources.
Amplitude corrections applied to a priori calibrated and
fringe-fitted data by self-calibration.
2134+004:
pdf
, or
text file
, or
statistical summary
.
3C454.3:
pdf
, or
text file
, or
statistical summary
.
IRAS2336: pdf (not available)
, or
text file (not available)
, or
statistical summary (not available)
.
J2330+3348:
pdf
, or
text file
, or
statistical summary
.
J2333+3901:
pdf
, or
text file
, or
statistical summary
.
Comments.
As above, but for the post-SPLIT table SN2.
Telescope sensitivities
(the total AMP gain applied
during both a priori and self calibration; the square of this number gives the
antenna noise (SEFD) in Jy).
Comments.
CL4 gain-amp.
Residual closure phase (visibility closure phase with model closure phase subtracted) for:
2134+004
.
3C454.3
.
IRAS2336 (not available)
.
J2330+3348
.
J2333+3901
.
Comments.
Separate files per (fringed) source, showing closure phase plots for all the triangles (not just Ef-*-*). Only stokes=I shown.
Calibrated visibilities and the source model of:
2134+004
.
3C454.3
.
IRAS2336 (not available)
.
J2330+3348
.
J2333+3901
.
Comments.
For each (fringed) source, plots of amp/phase on Ef-* baselines, calibrated with (post-SPLIT) table CL3, with a model-line overplotted.
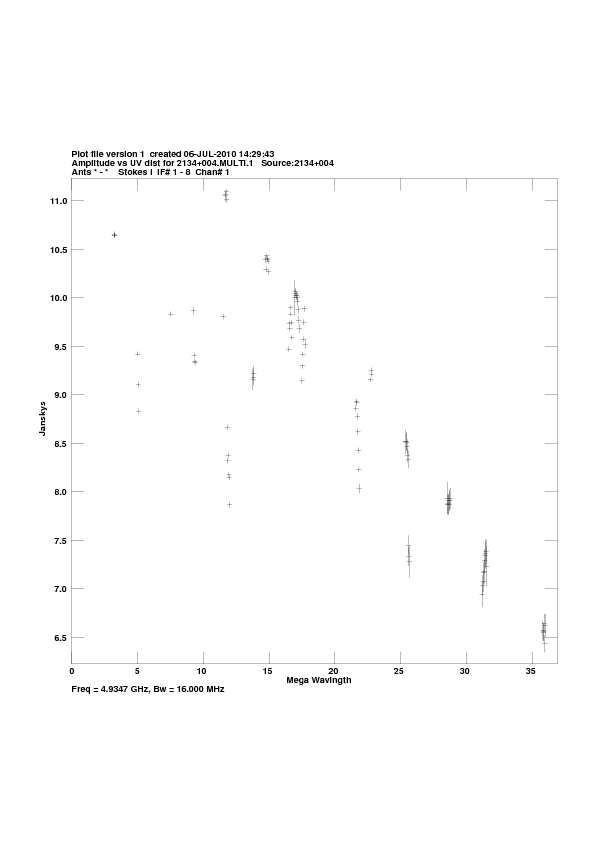
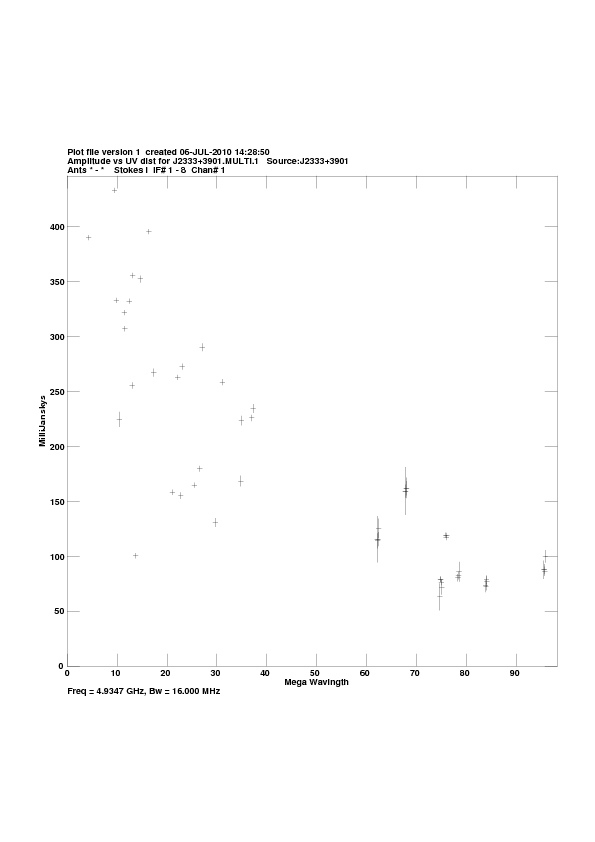
Calibrated visibilities against u,v distance for:
2134+004:
pdf
, or
png
.
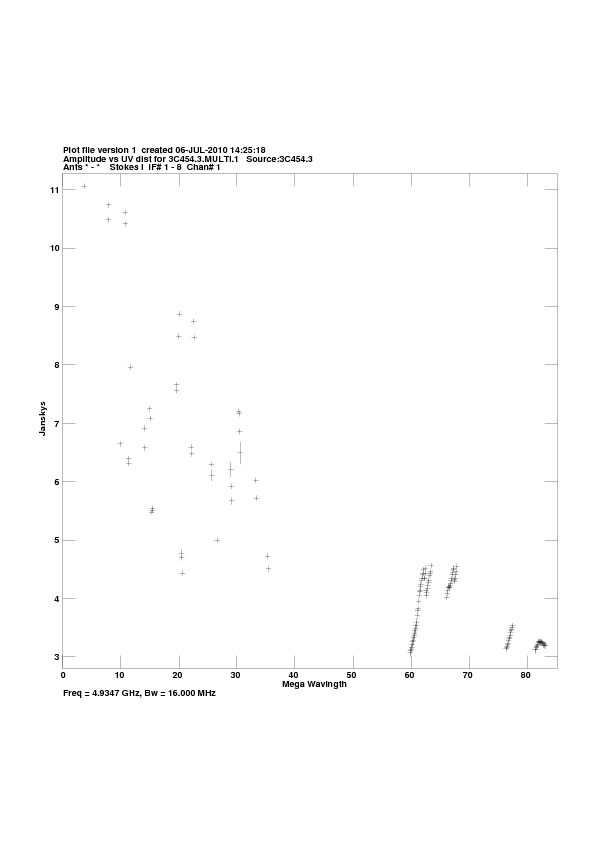
3C454.3:
pdf
, or
png
.
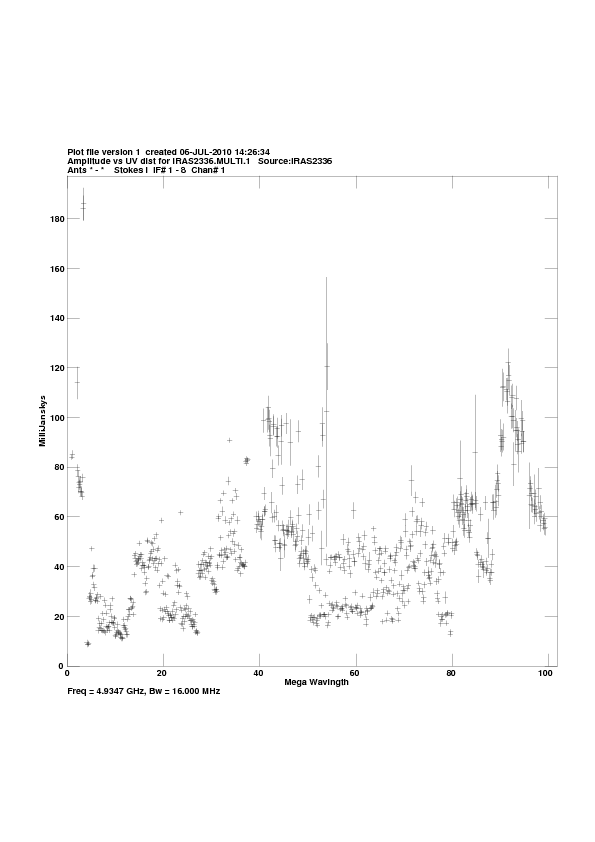
IRAS2336:
pdf
, or
png
.
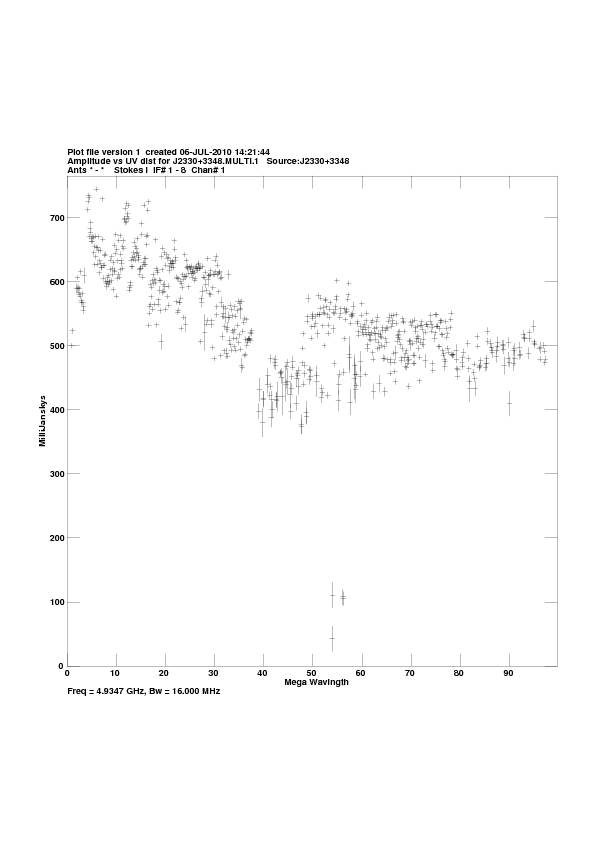
J2330+3348:
pdf
, or
png
.
J2333+3901:
pdf
, or
png
.
Comments.
For each source, a plot of amp vs. |uv| distance.
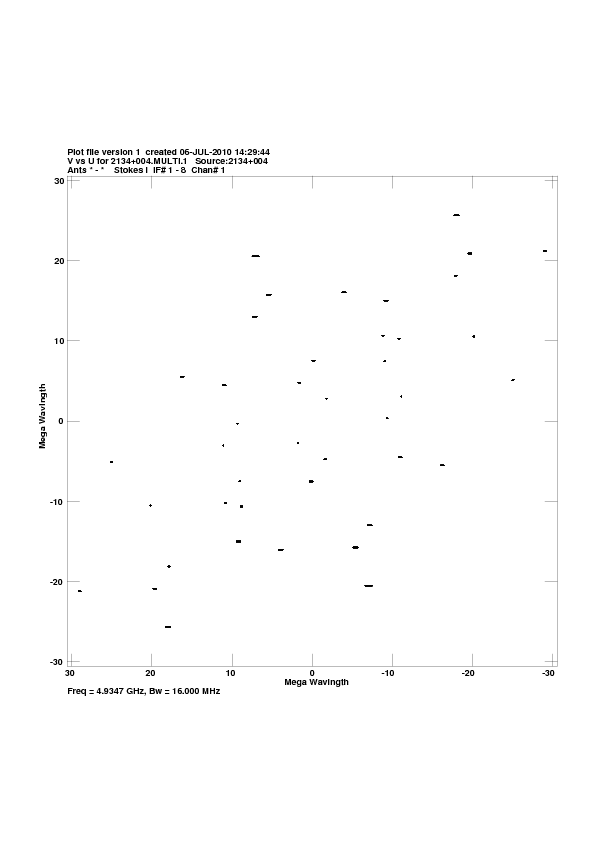
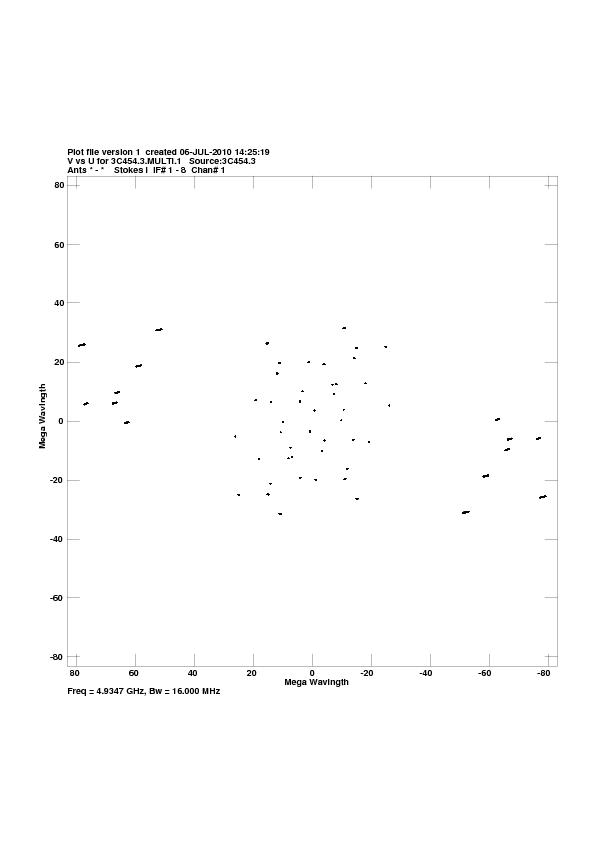
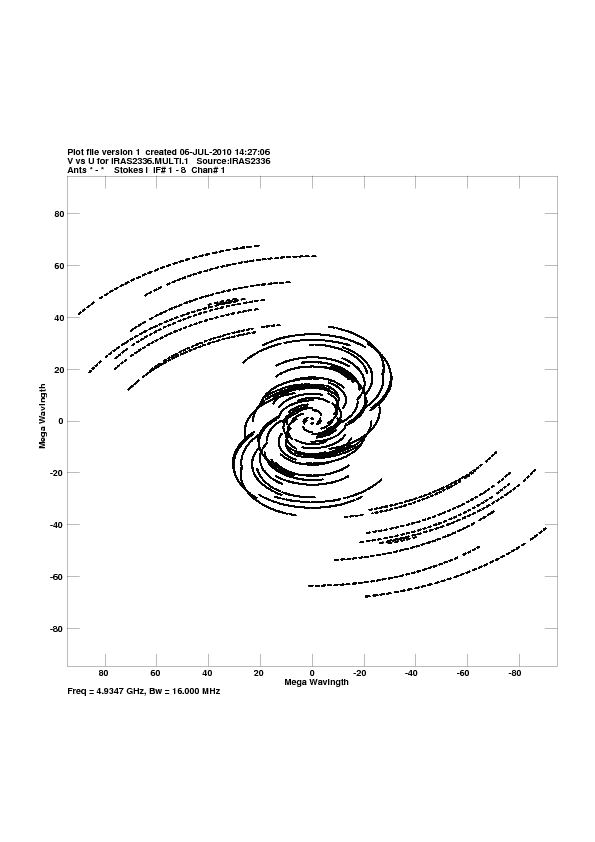
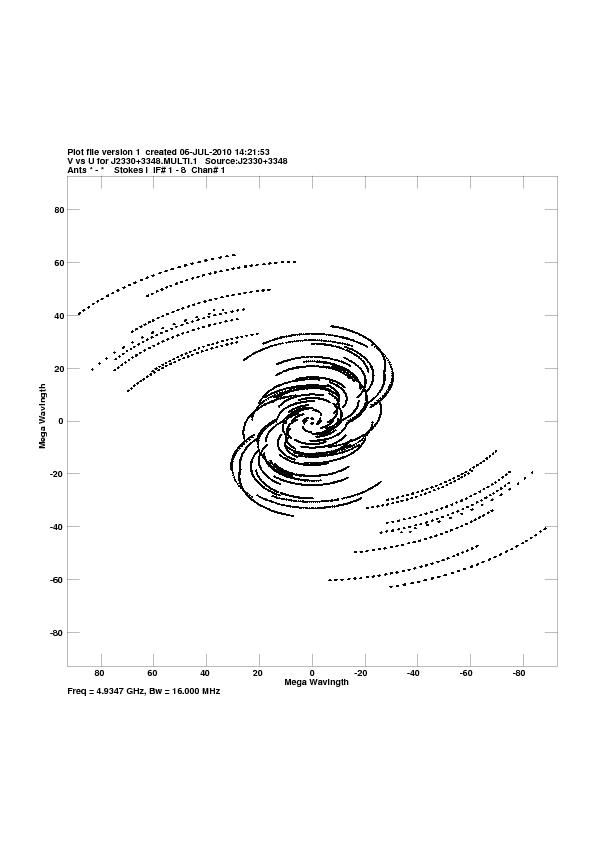
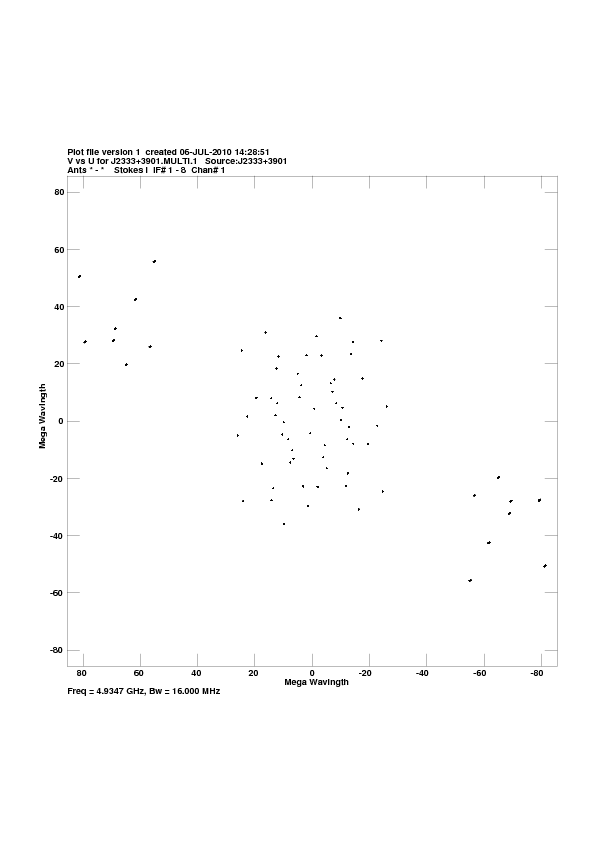
u,v coverage for:
2134+004:
pdf
, or
png
.
3C454.3:
pdf
, or
png
.
IRAS2336:
pdf
, or
png
.
J2330+3348:
pdf
, or
png
.
J2333+3901:
pdf
, or
png
.
Comments.
For each source, a plot of the u-v coverage.
Crude maps of sources:
2134+004:
pdf
, or
FITS
.
3C454.3:
pdf
, or
FITS
.
IRAS2336:
pdf
, or
FITS
.
J2330+3348:
pdf
, or
FITS
.
J2333+3901:
pdf
, or
FITS
.
Comments.
For each source, a CLEAN map resulting from the automated fringing and self-cal iterations (or phase-referencing) in the pipeline script.