
EVN User Experiment Pipeline Feedback
Last updated: Fri Sep 21 10:15:27 CEST 2012
campbell@jive.nl
General Comments.
(
Brief data summary
and
scan listing
)
GF018A had 19 stations, 8 8MHz IFs, two polarizations, 64 frequency points per IF/pol, and 0.25s integrations. Considerably more information is included in the experiment's cover letter on the standard-plots portion of the EVN Archive. In the pipelining, the target source was treated as a phase-reference target (from J0958+65), and was not separately fringe-fit. The SOLINT was set automatically to a value commensurate with a typical reference-source scan (~120s) Ef, and then Nl were used as the reference stations.
The EVN reliability indicator (ERI) for this experiment was
ERI = 0.671 . ERI* = 0.671 .
The losses include all of Jb1 and half of Sv (LCP). Further, the losses of other stations over limited time ranges: Mc (2220-0520), Nt (0345-0435), Tr (2200-2315), Zc (1130-1645). The ERI reflects only the EVN stations, so is not affected by the loss of La and Sc.
Plots of the autocorrelations
Comments.
Each scan plotted separately, all stations.
plots of the uncalibrated amplitude and phase
against time
Comments.
Full-experiment for Ef-* baselines, no calibration applied. A 2 minute plot-averaging was used.
Plots of the uncalibrated amplitude and phase
against frequency channel
Comments.
Scalar averaged Ef-* baselines, each scan plotted separately. No calibration applied yet.
The uncalibrated amplitude and phase of the crosshand
correlations against frequency channel
(not available)
Comments.
TSYS against time
Comments.
TY1 table, each IF/pol on a separate plot.
Telescope sensitivities
from the a priori TSYS and Gain
curves (the square of this number gives the antenna noise (SEFD) in Jy - the
smaller the better).
Comments.
Gain amplitude from CL2 table.
Fringe-fit phase solutions
(including Parallactic
Angle correction).
Comments.
CL3 station phase solutions -- CL3 = CL2+SN2, thus also includes the initial amplitude/parallactic angle calibration from CL2 and the fringe solutions from SN2.
Fringe-fit delay solutions
Comments.
SN2 station delay solutions for the fringed sources, each IF/pol on a separate plot. Almost all stations have an outlier in most IFs/pols between 0100-0200 (thus likely in Ef). Jb and Sv/LL aren't flagged at this stage by having no fringes (I didn't flag them explicitly via the UVFLG file). For this experiment, one lag corresponds to 1/16 microsecond of delay.
Fringe-fit rate solutions
Comments.
SN2 station rate solutions. The outlier between 0100-0200 persists (and carries forward into the fring_phas plot as a period of high phase-gradient).
Telescope bandpasses
Comments.
Bandpass table 1. 3C84 and J0927+39 were used for bandpass calibration.
Calibrated amplitude and phase against time
(a
priori amplitude calibration and fringe-fit solutions applied).
Comments.
Full-experiment for Ef-* baselines, calibrated with CL3. The 2-min plot-averaging still applied.
Calibrated amplitude and phase against frequency
channel
Comments.
Ef-* baselines calibrated with CL3 and BP1. The amp and phase plots self-scale, not necessarily going down to 0 in the case of the amps.
Naturally weighted dirty map (not useful for bright sources)
produced before self-cal of:
M82:
pdf
, or
FITS
.
3C84: pdf (not available)
, or
FITS (not available)
.
J0958+65: pdf (not available)
, or
FITS (not available)
.
J0927+39: pdf (not available)
, or
FITS (not available)
.
Comments.
Naturally-weighted dirty maps of the target.
Uniformly weighted dirty map (not useful for bright sources)
produced before self-cal of:
M82:
pdf
, or
FITS
.
3C84: pdf (not available)
, or
FITS (not available)
.
J0958+65: pdf (not available)
, or
FITS (not available)
.
J0927+39: pdf (not available)
, or
FITS (not available)
.
Comments.
Uniformly-weighted dirty maps of the target.
Phase corrections applied to a priori calibrated and
fringe-fitted data by self-calibration.
M82 (not available)
.
3C84
.
J0958+65
.
J0927+39
.
Comments.
Plots of post-SPLIT tables SN1 for the sources that have been individually fringed.
Amplitude corrections applied to a priori calibrated and
fringe-fitted data by self-calibration.
M82: pdf (not available)
, or
text file (not available)
, or
statistical summary (not available)
.
3C84:
pdf
, or
text file
, or
statistical summary
.
J0958+65:
pdf
, or
text file
, or
statistical summary
.
J0927+39:
pdf
, or
text file
, or
statistical summary
.
Comments.
As above, but for the post-SPLIT table SN2.
Telescope sensitivities
(the total AMP gain applied
during both a priori and self calibration; the square of this number gives the
antenna noise (SEFD) in Jy).
Comments.
CL4 gain-amp.
Residual closure phase (visibility closure phase with model closure phase subtracted) for:
M82 (not available)
.
3C84
.
J0958+65
.
J0927+39
.
Comments.
Separate files per (fringed) source, showing closure phase plots for all the triangles. Only stokes=I shown.
Calibrated visibilities and the source model of:
M82 (not available)
.
3C84
.
J0958+65
.
J0927+39
.
Comments.
For each (fringed) source, plots of amp/phase on Ef-* baselines, calibrated with (post-SPLIT) table CL3, with a model-line overplotted.
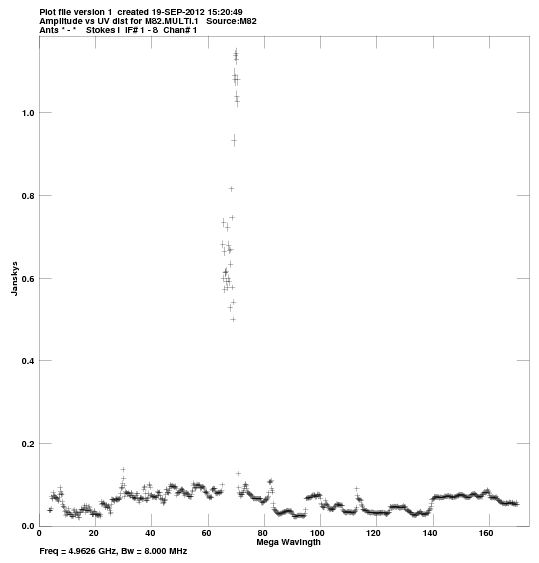
Calibrated visibilities against u,v distance for:
M82:
pdf
, or
png
.
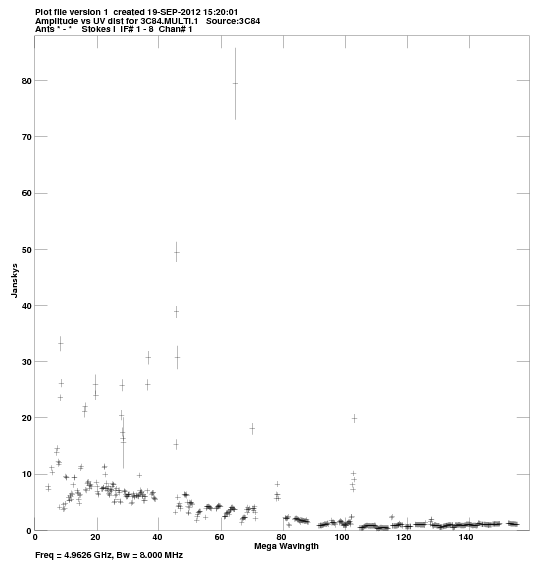
3C84:
pdf
, or
png
.
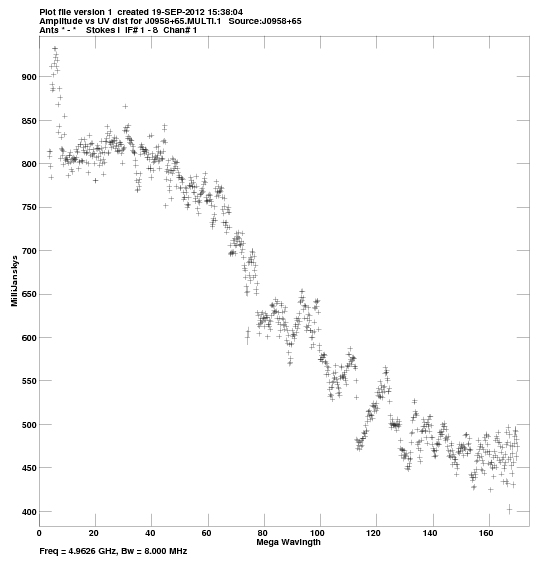
J0958+65:
pdf
, or
png
.
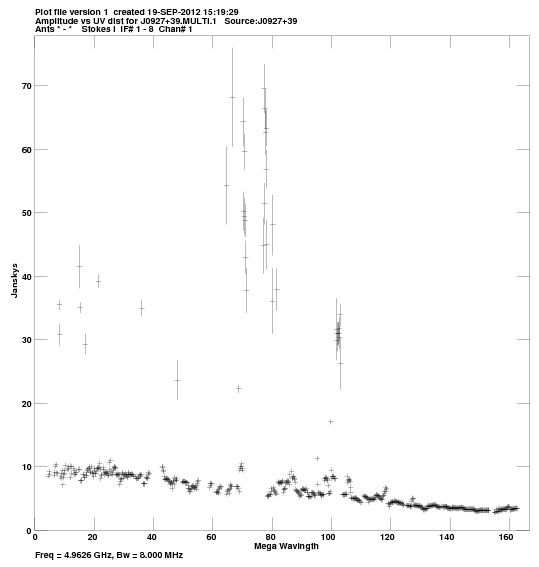
J0927+39:
pdf
, or
png
.
Comments.
For each source, a plot of amp vs. |uv| distance.
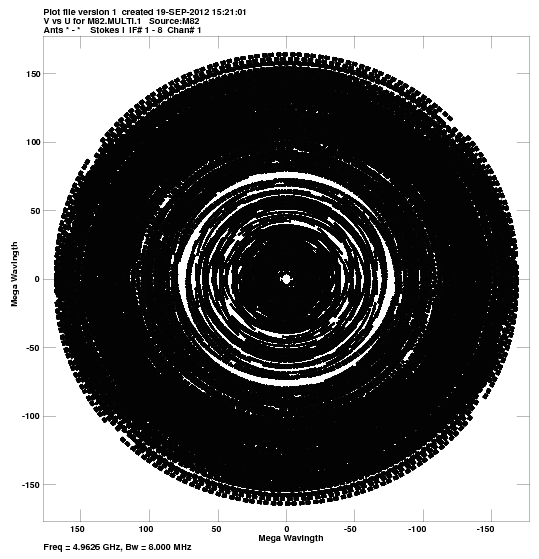
u,v coverage for:
M82:
pdf
, or
png
.
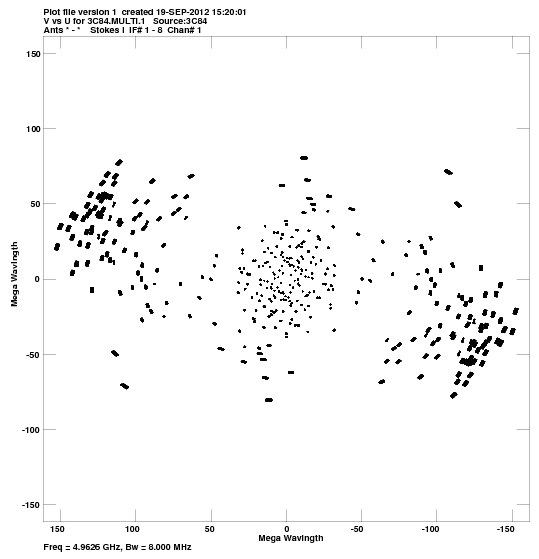
3C84:
pdf
, or
png
.
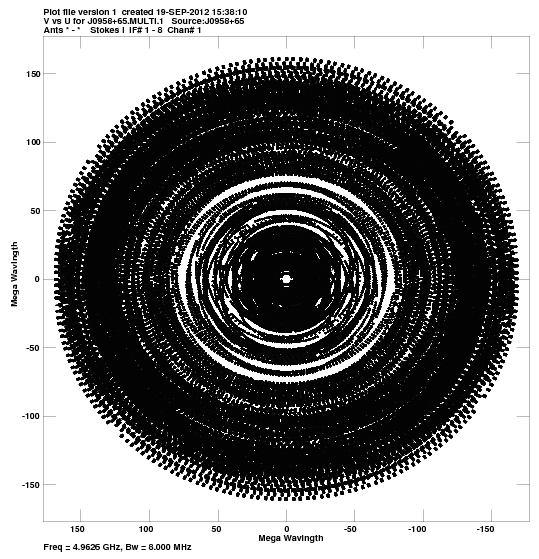
J0958+65:
pdf
, or
png
.
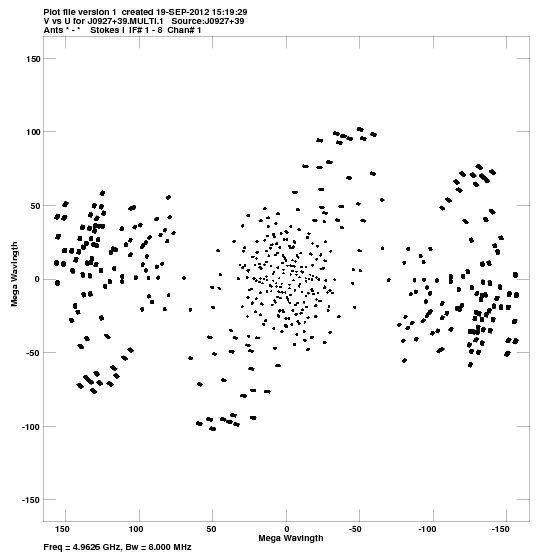
J0927+39:
pdf
, or
png
.
Comments.
For each source, a plot of the u-v coverage.
Crude maps of sources:
M82:
pdf
, or
FITS
.
3C84:
pdf
, or
FITS
.
J0958+65:
pdf
, or
FITS
.
J0927+39:
pdf
, or
FITS
.
Comments.
For each source, a CLEAN map resulting from the automated fringing and self-cal iterations (or phase-referencing) in the pipeline script.