
EVN User Experiment Pipeline Feedback
Last updated: Mon Nov 23 11:32:42 CET 2015
surcis@jive.eu
General Comments.
(
Brief data summary
and
scan listing
)
The line correlation of EO013 had 8 stations, 1 32MHz IF, two polarizations, 2048 frequency points per IF/pol, and 2s integrations. Considerably more information is included in the experiment's cover letter on the standard-plots portion of the EVN Archive. Ef and O8 were used as the reference stations.
The EVN reliability indicator (ERI) for this experiment was
ERI = 0.77 . ERI* = 0.77 .
(Ef=0.63, Wb=1.0, O8=1.0, Mc=0.5, Tr=0.97, Sv=1.0, Zc=1.0, Bd=1.0)
Plots of the autocorrelations
Comments.
Each scan plotted separately, all stations. Several RFIs.
plots of the uncalibrated amplitude and phase
against time
Comments.
Full-experiment for Ef-* and O8-* baselines, no calibration applied. A 2.5 minute plot-averaging was used.
Plots of the uncalibrated amplitude and phase
against frequency channel
Comments.
Scalar averaged Ef-* and O8-* baselines, each scan plotted separately. No calibration applied yet.
The uncalibrated amplitude and phase of the crosshand
correlations against frequency channel
(not available)
Comments.
TSYS against time
Comments.
TY1 table, each IF/pol on a separate plot.
Telescope sensitivities
from the a priori TSYS and Gain
curves (the square of this number gives the antenna noise (SEFD) in Jy - the
smaller the better).
Comments.
Gain amplitude from CL2 table.
Fringe-fit phase solutions
(including Parallactic
Angle correction).
Comments.
CL3 station phase solutions -- CL3 = CL2+SN2, thus also includes the initial amplitude/parallactic angle calibration from CL2 and the fringe solutions from SN2.
Fringe-fit delay solutions
Comments.
SN2 station delay solutions for the fringed sources, each IF/pol on a separate plot.
Fringe-fit rate solutions
Comments.
SN2 station rate solutions.
Telescope bandpasses
Comments.
Bandpass table 1. 3C454.3 and DA193 were used for bandpass calibration.
Calibrated amplitude and phase against time
(a
priori amplitude calibration and fringe-fit solutions applied).
Comments.
Full-experiment for Ef-* and O8-* baselines, calibrated with CL3. The 2.5-min plot-averaging still applied.
Calibrated amplitude and phase against frequency
channel
Comments.
Ef-* and O8-* baselines calibrated with CL3 and BP1. The amp and phase plots self-scale, not necessarily going down to 0 in the case of the amps.
Naturally weighted dirty map (not useful for bright sources)
produced before self-cal of:
3C454.3: pdf (not available)
, or
FITS (not available)
.
4C39.25: pdf (not available)
, or
FITS (not available)
.
DA193: pdf (not available)
, or
FITS (not available)
.
3C84: pdf (not available)
, or
FITS (not available)
.
Comments.
Naturally-weighted dirty maps of the sources.
Uniformly weighted dirty map (not useful for bright sources)
produced before self-cal of:
3C454.3: pdf (not available)
, or
FITS (not available)
.
4C39.25: pdf (not available)
, or
FITS (not available)
.
DA193: pdf (not available)
, or
FITS (not available)
.
3C84: pdf (not available)
, or
FITS (not available)
.
Comments.
Uniformly-weighted dirty maps of the sources.
Phase corrections applied to a priori calibrated and
fringe-fitted data by self-calibration.
3C454.3
.
4C39.25
.
DA193
.
3C84
.
Comments.
Plots of post-SPLIT tables SN1 for the sources that have been individually fringed.
Amplitude corrections applied to a priori calibrated and
fringe-fitted data by self-calibration.
3C454.3:
pdf
, or
text file
, or
statistical summary
.
4C39.25:
pdf
, or
text file
, or
statistical summary
.
DA193:
pdf
, or
text file
, or
statistical summary
.
3C84:
pdf
, or
text file
, or
statistical summary
.
Comments.
As above, but for the post-SPLIT table SN2.
Telescope sensitivities
(the total AMP gain applied
during both a priori and self calibration; the square of this number gives the
antenna noise (SEFD) in Jy).
Comments.
CL4 gain-amp.
Residual closure phase (visibility closure phase with model closure phase subtracted) for:
3C454.3
.
4C39.25
.
DA193
.
3C84
.
Comments.
Separate files per (fringed) source, showing closure phase plots for all the triangles. Only stokes=I shown.
Calibrated visibilities and the source model of:
3C454.3
.
4C39.25
.
DA193
.
3C84
.
Comments.
For each (fringed) source, plots of amp/phase on Ef-* and O8-* baselines, calibrated with (post-SPLIT) table CL3, with a model-line overplotted.
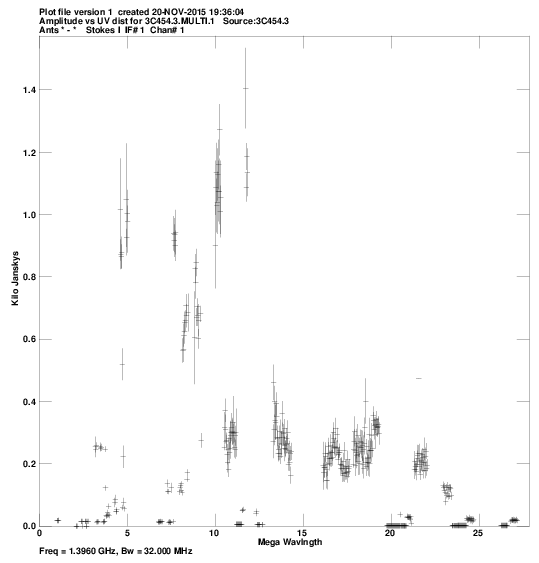
Calibrated visibilities against u,v distance for:
3C454.3:
pdf
, or
png
.
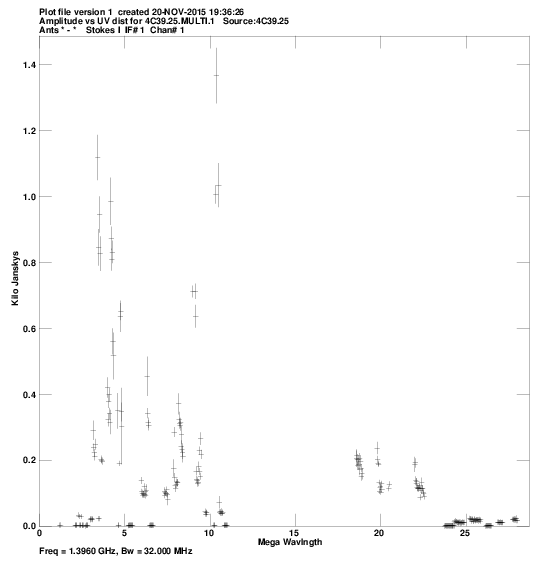
4C39.25:
pdf
, or
png
.
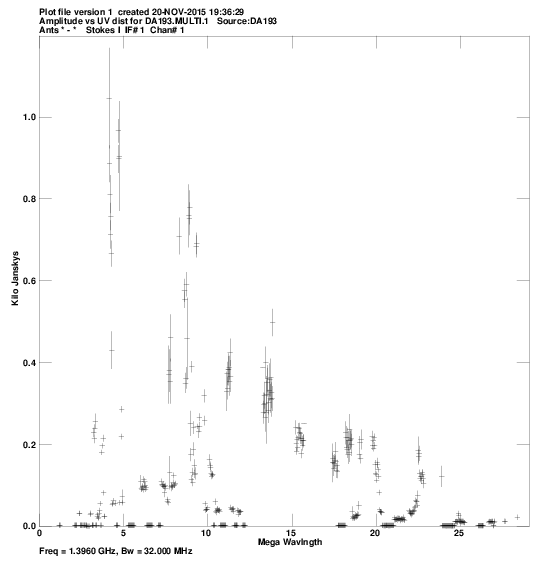
DA193:
pdf
, or
png
.
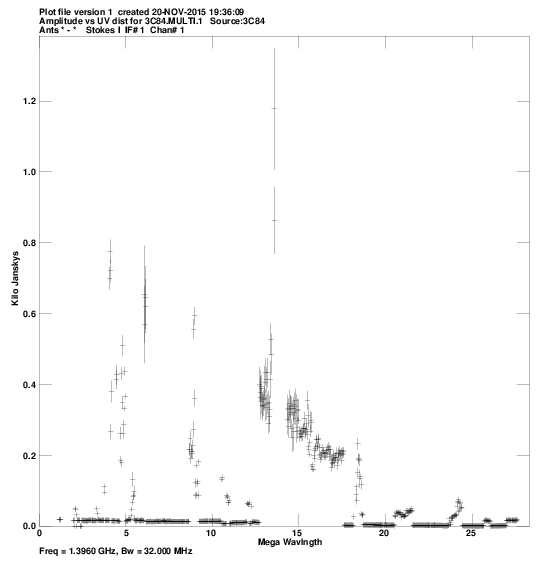
3C84:
pdf
, or
png
.
Comments.
For each source, a plot of amp vs. |uv| distance.
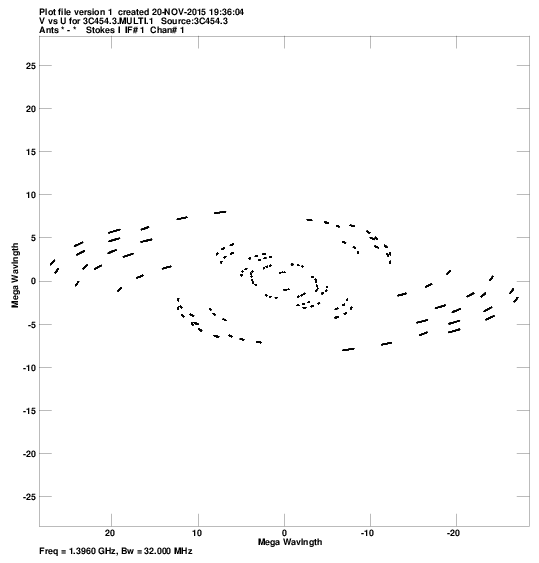
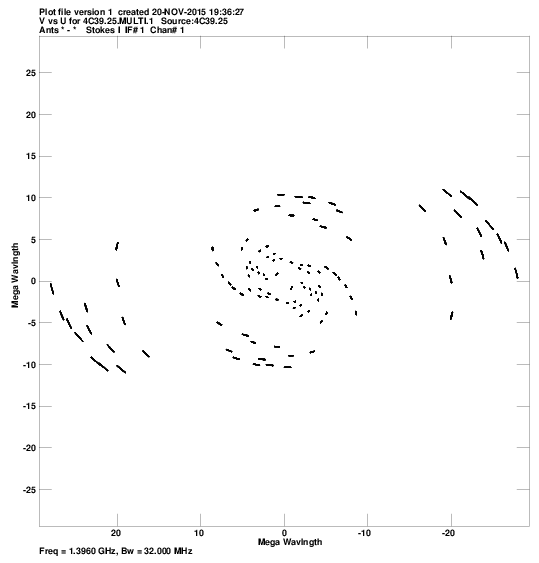
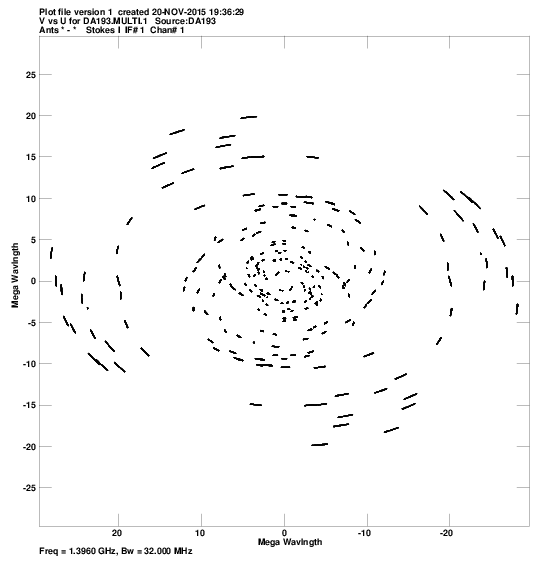
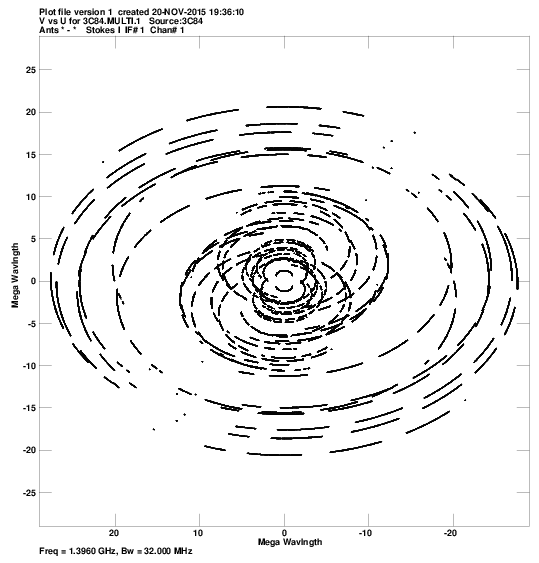
u,v coverage for:
3C454.3:
pdf
, or
png
.
4C39.25:
pdf
, or
png
.
DA193:
pdf
, or
png
.
3C84:
pdf
, or
png
.
Comments.
For each source, a plot of the u-v coverage.
Crude maps of sources:
3C454.3:
pdf
, or
FITS
.
4C39.25:
pdf
, or
FITS
.
DA193:
pdf
, or
FITS
.
3C84:
pdf
, or
FITS
.
Comments.
For each source, a CLEAN map resulting from the automated fringing and self-cal iterations (or phase-referencing) in the pipeline script.