
EVN User Experiment Pipeline Feedback
Last updated: Thu Jan 25 11:23:58 CET 2018
immer@jive.eu
General Comments.
(
Brief data summary
and
scan listing
)
EP103D. C band EVN phase-referencing experiment, observed on 09 Jun 2017. The data rate was 4096 Mbps (16 x 32 MHz subbands, dual polarization, two-bit sampling). FRB, VLA1, VLA2, VLA3, and VLA4 are the target sources. INBEAM is the check source. J0529+3209, J0518+3306, DA193, and 0234+285 were also observed as calibrators and the fringe finders.
16 stations participated.
The EVN reliability indicator (ERI) for this experiment was
ERI = . ERI* = .
Plots of the autocorrelations
Comments.
Each scan plotted separately, all stations.
Plots of the uncalibrated amplitude and phase
against time
Comments.
Full-experiment for Mc-** baselines, no calibration applied. A 1.5 minute plot-averaging was used.
Plots of the uncalibrated amplitude and phase
against frequency channel
Comments.
Scalar averaged Mc-** baselines, each scan plotted separately. No calibration applied yet.
The uncalibrated amplitude and phase of the crosshand
correlations against frequency channel
Comments.
TSYS against time
Comments.
TY1 table, each IF/pol on a separate plot.
Telescope sensitivities
from the a priori TSYS and Gain
curves (the square of this number gives the antenna noise (SEFD) in Jy - the
smaller the better).
Comments.
Gain amplitude from CL2 table.
Fringe-fit phase solutions
(including Parallactic
Angle correction).
Comments.
CL3 station phase solutions -- CL3 = CL2+SN2, thus also includes the initial amplitude/parallactic angle calibration from CL2 and the fringe solutions from SN2.
Fringe-fit delay solutions
Comments.
SN2 station delay solutions for the fringed sources, each IF/pol on a separate plot.
Fringe-fit rate solutions
Comments.
SN2 station rate solutions.
Telescope bandpasses
Comments.
Bandpass table 1. DA193 and 0234+285 were used for bandpass calibration.
Calibrated amplitude and phase against time
(a
priori amplitude calibration and fringe-fit solutions applied).
Comments.
Full-experiment for Mc-** baselines, calibrated with CL3. The 1.5-min plot-averaging still applied.
Calibrated amplitude and phase against frequency
channel
Comments.
Mc-** baselines calibrated with CL3 and BP1. The amp and phase plots self-scale, not necessarily going down to 0 in the case of the amps.
Naturally weighted dirty map (not useful for bright sources)
produced before self-cal of:
0234+285: pdf (not available)
, or
FITS (not available)
.
J0529+3209: pdf (not available)
, or
FITS (not available)
.
FRB:
pdf
, or
FITS
.
INBEAM: pdf (not available)
, or
FITS (not available)
.
J0518+3306: pdf (not available)
, or
FITS (not available)
.
J0530+3301: pdf (not available)
, or
FITS (not available)
.
J0637+2319: pdf (not available)
, or
FITS (not available)
.
DA193: pdf (not available)
, or
FITS (not available)
.
Comments.
Uniformly weighted dirty map (not useful for bright sources)
produced before self-cal of:
0234+285: pdf (not available)
, or
FITS (not available)
.
J0529+3209: pdf (not available)
, or
FITS (not available)
.
FRB:
pdf
, or
FITS
.
INBEAM: pdf (not available)
, or
FITS (not available)
.
J0518+3306: pdf (not available)
, or
FITS (not available)
.
J0530+3301: pdf (not available)
, or
FITS (not available)
.
J0637+2319: pdf (not available)
, or
FITS (not available)
.
DA193: pdf (not available)
, or
FITS (not available)
.
Comments.
Phase corrections applied to a priori calibrated and
fringe-fitted data by self-calibration.
0234+285
.
J0529+3209
.
FRB (not available)
.
INBEAM
.
J0518+3306
.
J0530+3301
.
J0637+2319
.
DA193
.
Comments.
Plots of post-SPLIT tables SN1 for the sources that have been individually fringed.
Amplitude corrections applied to a priori calibrated and
fringe-fitted data by self-calibration.
0234+285:
pdf
, or
text file
, or
statistical summary
.
J0529+3209:
pdf
, or
text file
, or
statistical summary
.
FRB: pdf (not available)
, or
text file (not available)
, or
statistical summary (not available)
.
INBEAM:
pdf
, or
text file
, or
statistical summary
.
J0518+3306:
pdf
, or
text file
, or
statistical summary
.
J0530+3301:
pdf
, or
text file
, or
statistical summary
.
J0637+2319:
pdf
, or
text file
, or
statistical summary
.
DA193:
pdf
, or
text file
, or
statistical summary
.
Comments.
As above, but for the post-SPLIT table SN2.
Telescope sensitivities
(the total AMP gain applied
during both a priori and self calibration; the square of this number gives the
antenna noise (SEFD) in Jy).
Comments.
CL4 gain-amp.
Residual closure phase (visibility closure phase with model closure phase subtracted) for:
0234+285
.
J0529+3209
.
FRB (not available)
.
INBEAM
.
J0518+3306
.
J0530+3301
.
J0637+2319
.
DA193
.
Comments.
Separate files per (fringed) source, showing closure phase plots for all the triangles. Only stokes=I shown.
Calibrated visibilities and the source model of:
0234+285
.
J0529+3209
.
FRB (not available)
.
INBEAM
.
J0518+3306
.
J0530+3301
.
J0637+2319
.
DA193
.
Comments.
For each (fringed) source, plots of amp/phase on Mc-** baselines, calibrated with (post-SPLIT) table CL3, with a model-line overplotted.
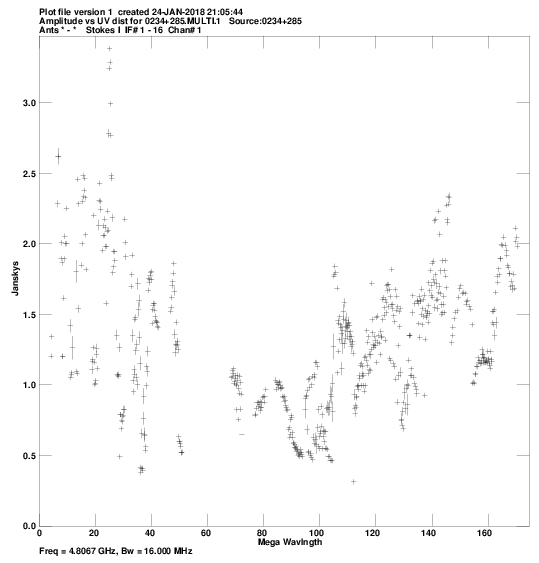
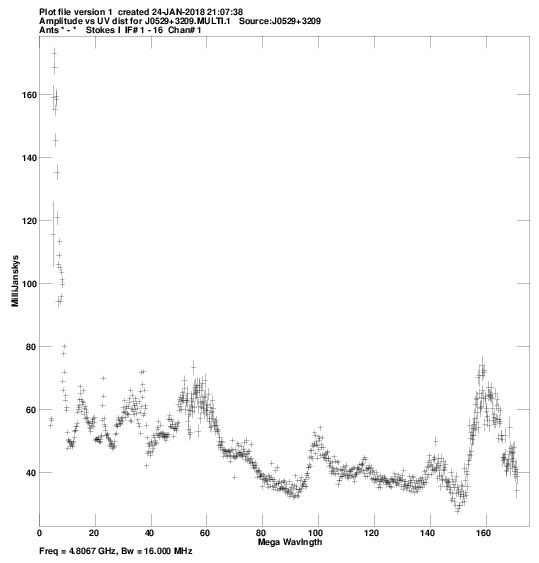
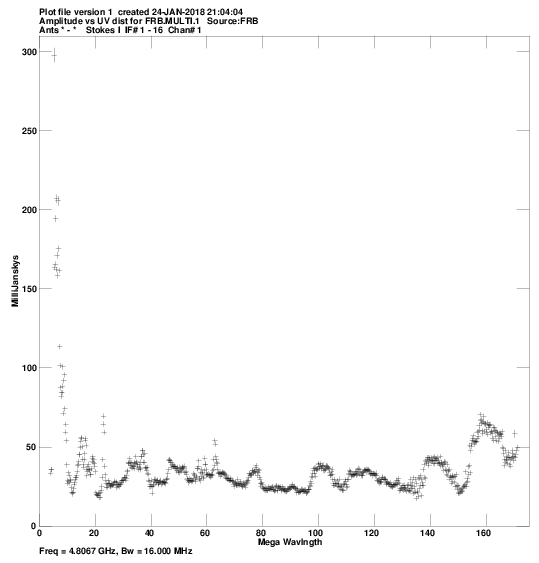
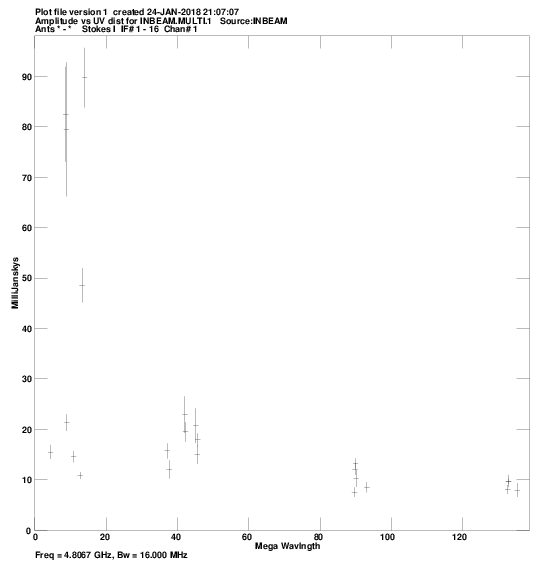
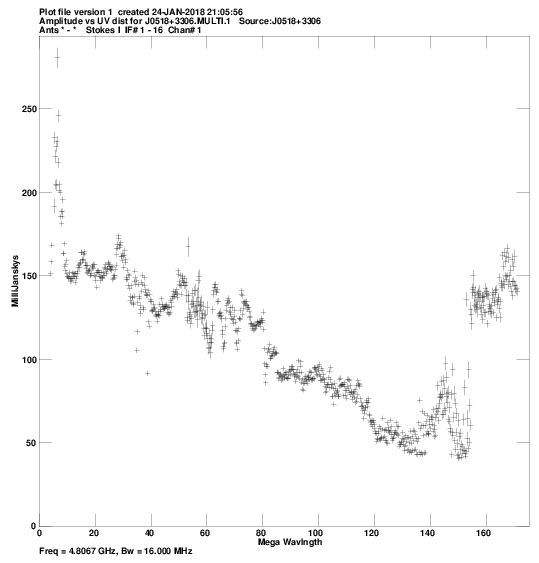
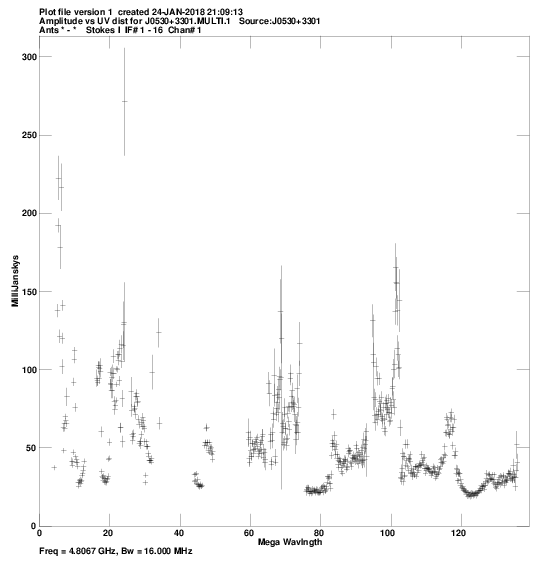
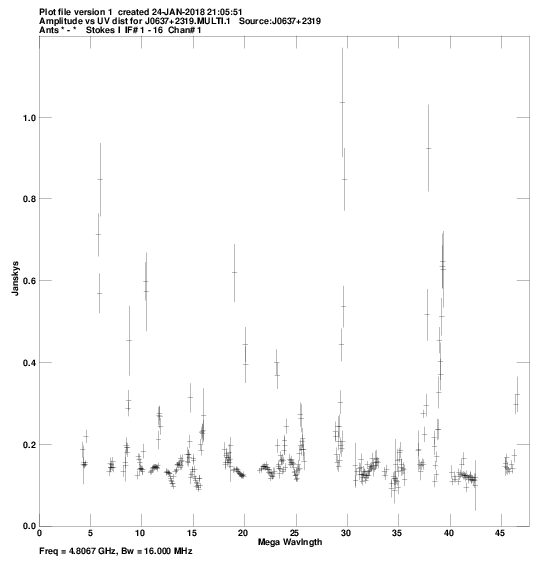
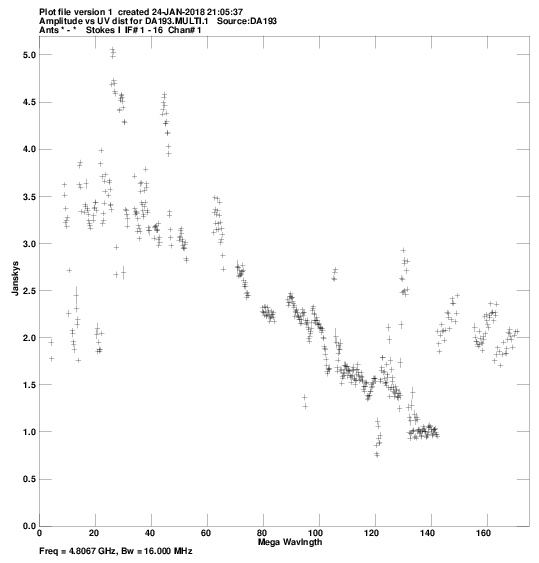
Calibrated visibilities against u,v distance for:
0234+285:
pdf
, or
png
.
J0529+3209:
pdf
, or
png
.
FRB:
pdf
, or
png
.
INBEAM:
pdf
, or
png
.
J0518+3306:
pdf
, or
png
.
J0530+3301:
pdf
, or
png
.
J0637+2319:
pdf
, or
png
.
DA193:
pdf
, or
png
.
Comments.
For each source, a plot of amp vs. |uv| distance.
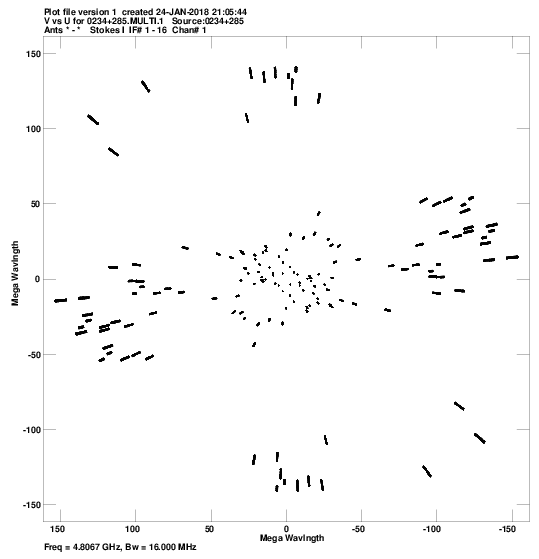
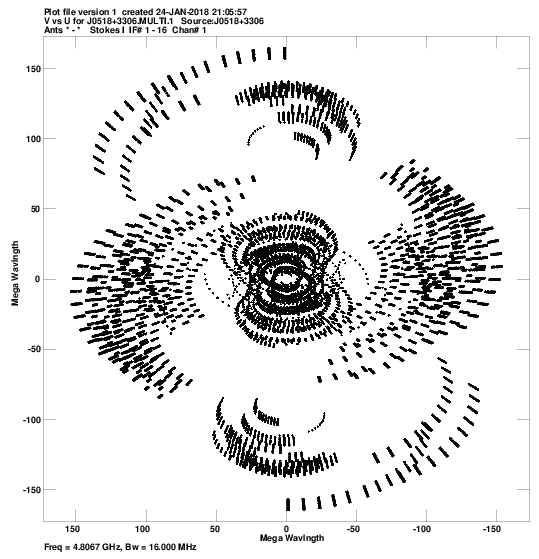
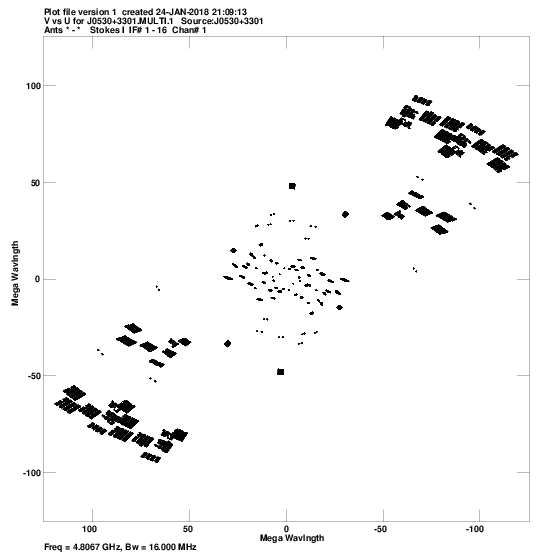
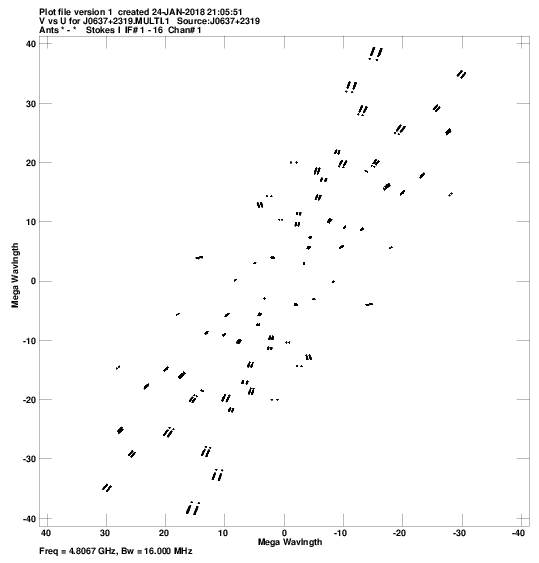
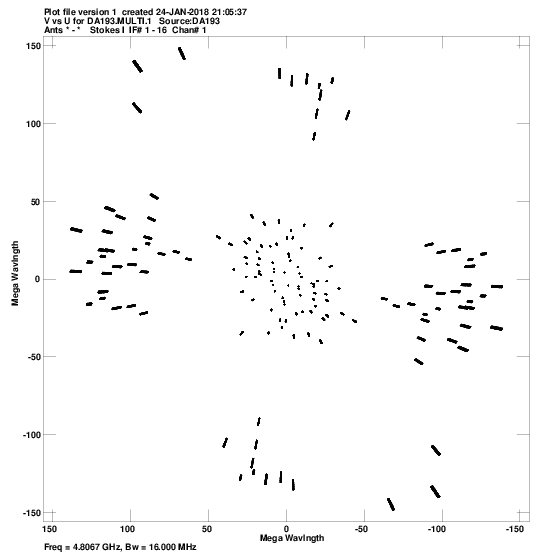
u,v coverage for:
0234+285:
pdf
, or
png
.
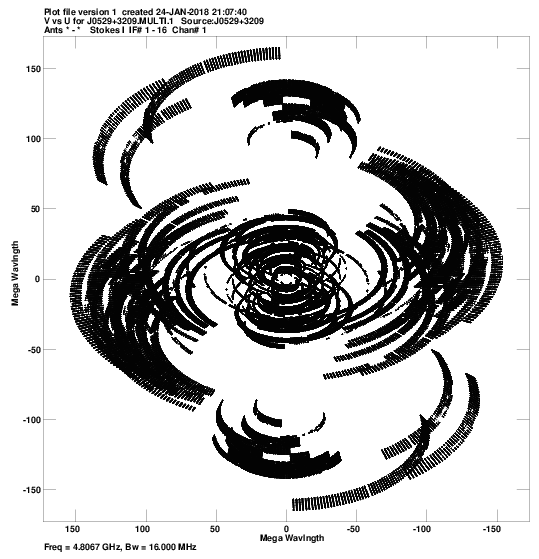
J0529+3209:
pdf
, or
png
.
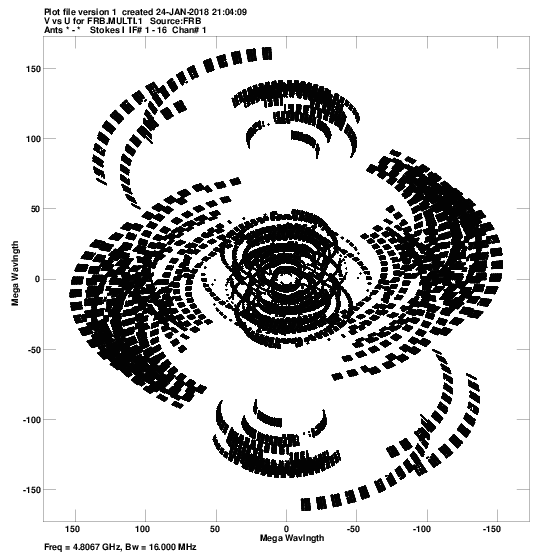
FRB:
pdf
, or
png
.
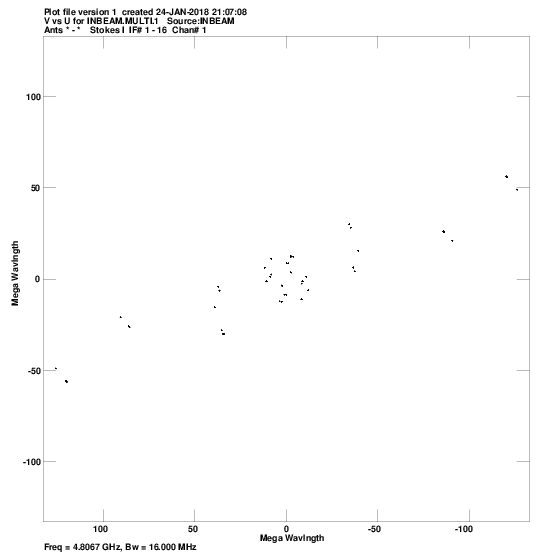
INBEAM:
pdf
, or
png
.
J0518+3306:
pdf
, or
png
.
J0530+3301:
pdf
, or
png
.
J0637+2319:
pdf
, or
png
.
DA193:
pdf
, or
png
.
Comments.
For each source, a plot of the u-v coverage.
Crude maps of sources:
0234+285:
pdf
, or
FITS
.
J0529+3209:
pdf
, or
FITS
.
FRB:
pdf
, or
FITS
.
INBEAM:
pdf
, or
FITS
.
J0518+3306:
pdf
, or
FITS
.
J0530+3301:
pdf
, or
FITS
.
J0637+2319:
pdf
, or
FITS
.
DA193:
pdf
, or
FITS
.
Comments.
For each source, a CLEAN map resulting from the automated fringing and self-cal iterations in the pipeline script.