
EVN User Experiment Pipeline Feedback
Last updated: Tue Feb 23 14:30:09 CET 2016
surcis@jive.eu
General Comments.
(
Brief data summary
and
scan listing
)
L band phase-referencing continuum experiment, observed on 17 June 2015. 10 stations participated in the experiment. Below are reported the pipeline results of the correlation pass for J132952+4712. This pass has 8 X 16 MHz subbands, dual polarization, and was correlated by using 64 frequency points per IF/pol, with 2s integrations. Ef was used as the reference station. The fringe-finder and bandpass calibrators were '3C286', '1156+295', and 'OQ208'. The target source 'J132952+4712' was calibrated using the phase-reference source 'J1332+4722'.
The EVN reliability indicator (ERI) for this experiment was
ERI = 0.74 . ERI* = 0.81 .
(EF=1, WB=1, JB=1, O8=0.6/1, MC=0.63, TR=0.88, SV=0.88, ZC=1, BD=0.80, SH=1)
Plots of the autocorrelations
Comments.
Each scan plotted separately, all stations. Several RFIs.
Plots of the uncalibrated amplitude and phase
against time
Comments.
Full-experiment for Ef-* baselines, no calibration applied.
Plots of the uncalibrated amplitude and phase
against frequency channel
Comments.
Scalar averaged Ef-* baselines, each scan plotted separately. No calibration applied yet.
The uncalibrated amplitude and phase of the crosshand
correlations against frequency channel
Comments.
Scalar averaged Ef-* baselines for LR, each scan plotted separately. No calibration applied yet.
TSYS against time
Comments.
TY1 table, each IF/pol on a separate plot.
Telescope sensitivities
from the a priori TSYS and Gain
curves (the square of this number gives the antenna noise (SEFD) in Jy - the
smaller the better).
Comments.
Gain amplitude from CL2 table.
Fringe-fit phase solutions
(including Parallactic
Angle correction).
Comments.
CL3 station phase solutions -- CL3 = CL2+SN2, thus also includes the initial amplitude/parallactic angle calibration from CL2 and the fringe solutions from SN2.
Fringe-fit delay solutions
Comments.
SN2 station delay solutions for the fringed sources, each IF/pol on a separate plot.
Fringe-fit rate solutions
Comments.
SN2 station rate solutions.
Telescope bandpasses
Comments.
Bandpass table 1. OQ208, 3C286, and 1156+295 were used for bandpass calibration.
Calibrated amplitude and phase against time
(a
priori amplitude calibration and fringe-fit solutions applied).
Comments.
Full-experiment for Ef-* baselines, calibrated with CL3.
Calibrated amplitude and phase against frequency
channel
Comments.
Ef-* baselines calibrated with CL3 and BP1. The amp and phase plots self-scale, not necessarily going down to 0 in the case of the amps.
Naturally weighted dirty map (not useful for bright sources)
produced before self-cal of:
J1332+4722: pdf (not available)
, or
FITS (not available)
.
OQ208: pdf (not available)
, or
FITS (not available)
.
1156+295: pdf (not available)
, or
FITS (not available)
.
3C286: pdf (not available)
, or
FITS (not available)
.
J132952+4712:
pdf
, or
FITS
.
Comments.
Naturally weighted dirty map of the targets.
Uniformly weighted dirty map (not useful for bright sources)
produced before self-cal of:
J1332+4722: pdf (not available)
, or
FITS (not available)
.
OQ208: pdf (not available)
, or
FITS (not available)
.
1156+295: pdf (not available)
, or
FITS (not available)
.
3C286: pdf (not available)
, or
FITS (not available)
.
J132952+4712:
pdf
, or
FITS
.
Comments.
Uniformly weighted dirty map of the targets.
Phase corrections applied to a priori calibrated and
fringe-fitted data by self-calibration.
J1332+4722
.
OQ208
.
1156+295
.
3C286
.
J132952+4712 (not available)
.
Comments.
Plots of post-SPLIT tables SN1 for the sources that have been individually fringed.
Amplitude corrections applied to a priori calibrated and
fringe-fitted data by self-calibration.
J1332+4722:
pdf
, or
text file
, or
statistical summary
.
OQ208:
pdf
, or
text file
, or
statistical summary
.
1156+295:
pdf
, or
text file
, or
statistical summary
.
3C286:
pdf
, or
text file
, or
statistical summary
.
J132952+4712: pdf (not available)
, or
text file (not available)
, or
statistical summary (not available)
.
Comments.
As above, but for the post-SPLIT table SN2.
Telescope sensitivities
(the total AMP gain applied
during both a priori and self calibration; the square of this number gives the
antenna noise (SEFD) in Jy).
Comments.
CL4 gain-amp.
Residual closure phase (visibility closure phase with model closure phase subtracted) for:
J1332+4722
.
OQ208
.
1156+295
.
3C286
.
J132952+4712 (not available)
.
Comments.
Separate files per (fringed) source, showing closure phase plots for all the triangles (not just Ef-*-*). Only stokes=I shown.
Calibrated visibilities and the source model of:
J1332+4722
.
OQ208
.
1156+295
.
3C286
.
J132952+4712 (not available)
.
Comments.
For each (fringed) source, plots of amp/phase on Ef-* baselines, calibrated with (post-SPLIT) table CL3, with a model-line overplotted.
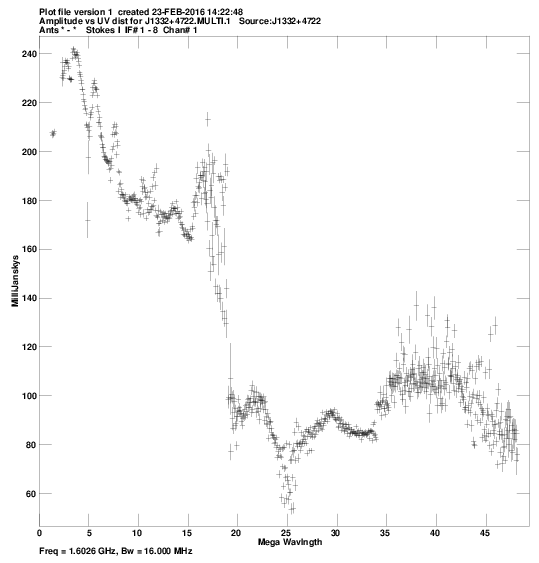
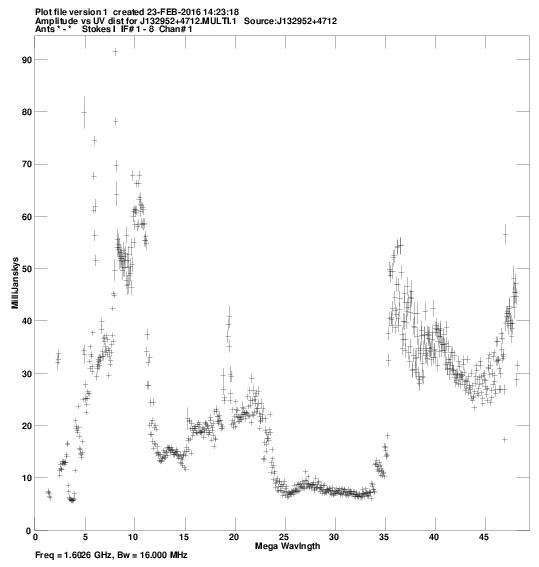
Calibrated visibilities against u,v distance for:
J1332+4722:
pdf
, or
png
.
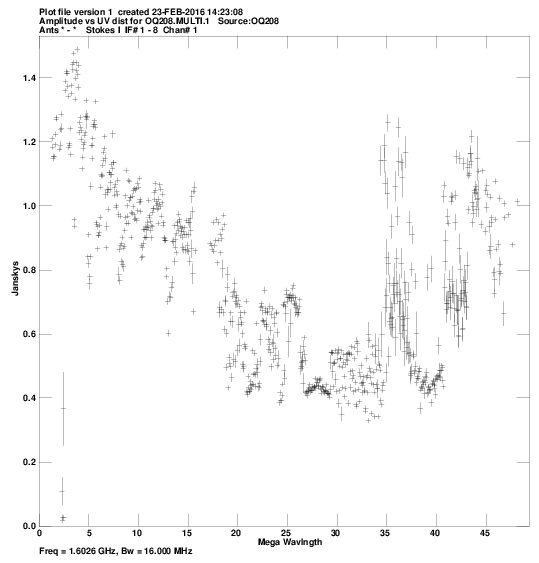
OQ208:
pdf
, or
png
.
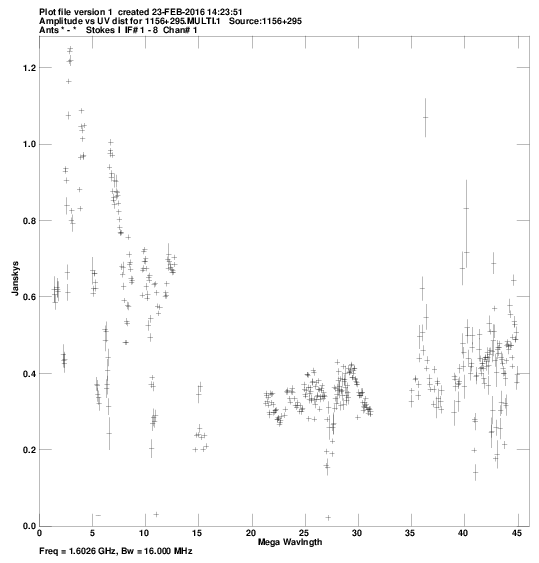
1156+295:
pdf
, or
png
.
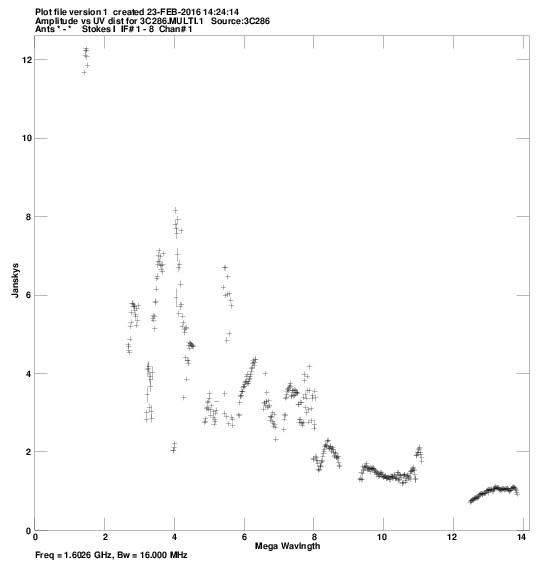
3C286:
pdf
, or
png
.
J132952+4712:
pdf
, or
png
.
Comments.
For each source, a plot of amp vs. |uv| distance.
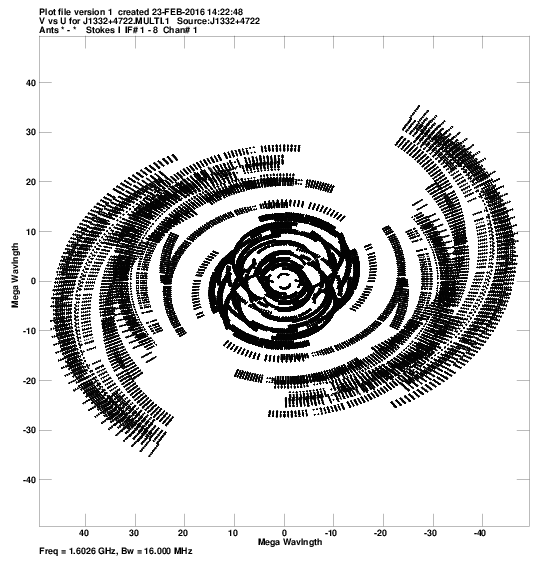
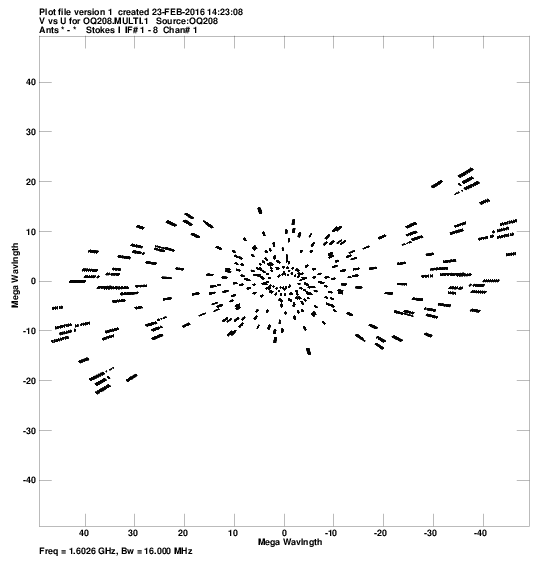
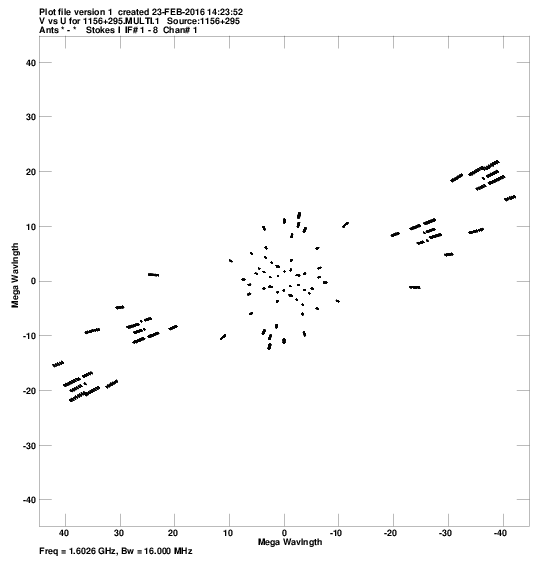
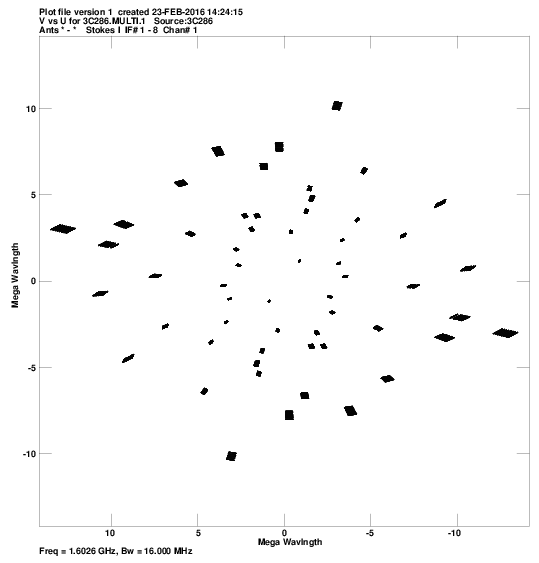
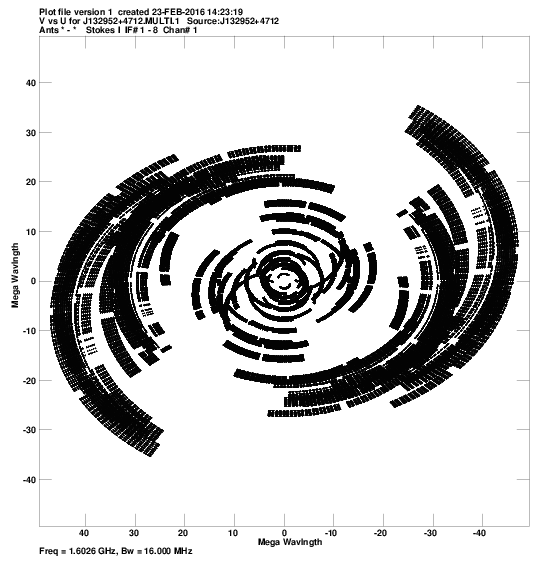
u,v coverage for:
J1332+4722:
pdf
, or
png
.
OQ208:
pdf
, or
png
.
1156+295:
pdf
, or
png
.
3C286:
pdf
, or
png
.
J132952+4712:
pdf
, or
png
.
Comments.
For each source, a plot of the u-v coverage.
Crude maps of sources:
J1332+4722:
pdf
, or
FITS
.
OQ208:
pdf
, or
FITS
.
1156+295:
pdf
, or
FITS
.
3C286:
pdf
, or
FITS
.
J132952+4712:
pdf
, or
FITS
.
Comments.
For each source, a CLEAN map resulting from the automated fringing and self-cal iterations in the pipeline script.