
EVN User Experiment Pipeline Feedback
Last updated: Fri Sep 26 18:29:19 CEST 2014
goddi@jive.nl
General Comments.
(
Brief data summary
and
scan listing
)
EH028B, C-band, 8 stations, 2014 Jun 16. Two passes were correlated: continuum mode with 8 4MHz IFs, 2 polarizations, 16 frequency points, and line mode with 1 4MHz IF, 2 pol, and 1024 frequency points. Both used 2s integrations. Considerably more information is included in the experiment's cover letter on the standard-plots portion of the EVN Archive. This pipelining corresponds to the line pass (Pass 2), which includes the maser source and the phase-reference sources. Ef was used as the reference stations.
The EVN reliability indicator (ERI) for this experiment was
ERI = 0.66 . ERI* = 0.66 .
Nt and Ys had the LO set wrong; Tr lost 1h of FS, tracking only the target (K3-35) from 01:44 to 2:44 UT; Jb had a control computer failure, causing loss of data at 20:40-21:14 UT and 3:30-03:55 UT (1h tot); On had a dec motor failure, after 0:40 only the ph-ref J1925+2106 was tracked. (Ef=1, Wb=1, Jb=0.87, On=0.53, Nt=0, Tr=0.87, Ys=0, T6=1)
Plots of the autocorrelations
Comments.
Each scan plotted separately, all stations.
plots of the uncalibrated amplitude and phase
against time
Comments.
Full-experiment for Ef-* baselines, no calibration applied. A 2 minute plot-averaging was used.
Plots of the uncalibrated amplitude and phase
against frequency channel
Comments.
Scalar averaged Ef-* baselines, each scan plotted separately. No calibration applied yet.
The uncalibrated amplitude and phase of the crosshand
correlations against frequency channel
Comments.
TSYS against time
Comments.
TY1 table, each IF/pol on a separate plot.
Telescope sensitivities
from the a priori TSYS and Gain
curves (the square of this number gives the antenna noise (SEFD) in Jy - the
smaller the better).
Comments.
Gain amplitude from CL2 table.
Fringe-fit phase solutions
(including Parallactic
Angle correction).
Comments.
CL3 station phase solutions -- CL3 = CL2+SN2, thus also includes the initial amplitude/parallactic angle calibration from CL2 and the fringe solutions from SN2.
Fringe-fit delay solutions
Comments.
SN2 station delay solutions for the fringed sources, each IF/pol on a separate plot.
Fringe-fit rate solutions
Comments.
SN2 station rate solutions.
Telescope bandpasses
Comments.
Bandpass table 1. J1751+0939, J2136+0041 was used for bandpass calibration.
Calibrated amplitude and phase against time
(a
priori amplitude calibration and fringe-fit solutions applied).
Comments.
Full-experiment for Ef-* baselines, calibrated with CL3.
Calibrated amplitude and phase against frequency
channel
Comments.
Ef-* baselines calibrated with CL3 and BP1. The amp and phase plots self-scale, not necessarily going down to 0 in the case of the amps.
Naturally weighted dirty map (not useful for bright sources)
produced before self-cal of:
J2136+0041: pdf (not available)
, or
FITS (not available)
.
J1751+0939: pdf (not available)
, or
FITS (not available)
.
J1925+2106: pdf (not available)
, or
FITS (not available)
.
K3-35:
pdf
, or
FITS
.
Comments.
Uniformly weighted dirty map (not useful for bright sources)
produced before self-cal of:
J2136+0041: pdf (not available)
, or
FITS (not available)
.
J1751+0939: pdf (not available)
, or
FITS (not available)
.
J1925+2106: pdf (not available)
, or
FITS (not available)
.
K3-35:
pdf
, or
FITS
.
Comments.
Phase corrections applied to a priori calibrated and
fringe-fitted data by self-calibration.
J2136+0041
.
J1751+0939
.
J1925+2106
.
K3-35 (not available)
.
Comments.
Plots of post-SPLIT tables SN1 for the sources that have been individually fringed.
Amplitude corrections applied to a priori calibrated and
fringe-fitted data by self-calibration.
J2136+0041:
pdf
, or
text file
, or
statistical summary
.
J1751+0939:
pdf
, or
text file
, or
statistical summary
.
J1925+2106:
pdf
, or
text file
, or
statistical summary
.
K3-35: pdf (not available)
, or
text file (not available)
, or
statistical summary (not available)
.
Comments.
As above, but for the post-SPLIT table SN2.
Telescope sensitivities
(the total AMP gain applied
during both a priori and self calibration; the square of this number gives the
antenna noise (SEFD) in Jy).
Comments.
CL4 gain-amp.
Residual closure phase (visibility closure phase with model closure phase subtracted) for:
J2136+0041
.
J1751+0939
.
J1925+2106
.
K3-35 (not available)
.
Comments.
Separate files per (fringed) source, showing closure phase plots for all the triangles. Only stokes=I shown.
Calibrated visibilities and the source model of:
J2136+0041
.
J1751+0939
.
J1925+2106
.
K3-35 (not available)
.
Comments.
For each (fringed) source, plots of amp/phase on Ef-* baselines, calibrated with (post-SPLIT) table CL3, with a model-line overplotted.
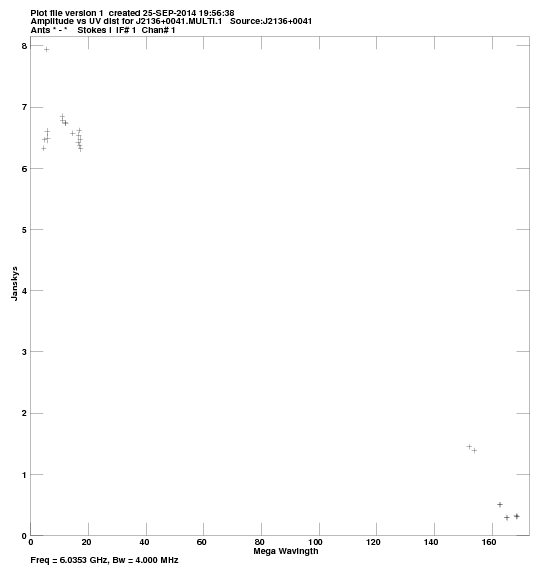
Calibrated visibilities against u,v distance for:
J2136+0041:
pdf
, or
png
.
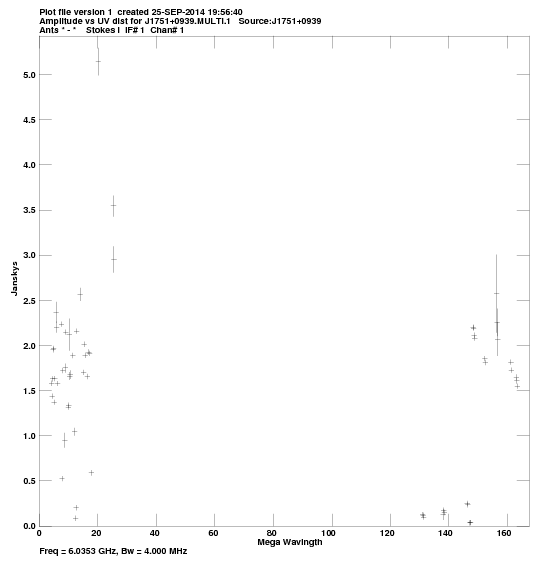
J1751+0939:
pdf
, or
png
.
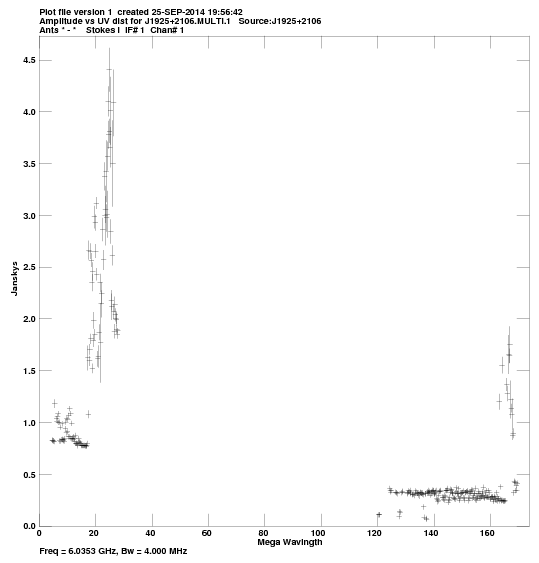
J1925+2106:
pdf
, or
png
.
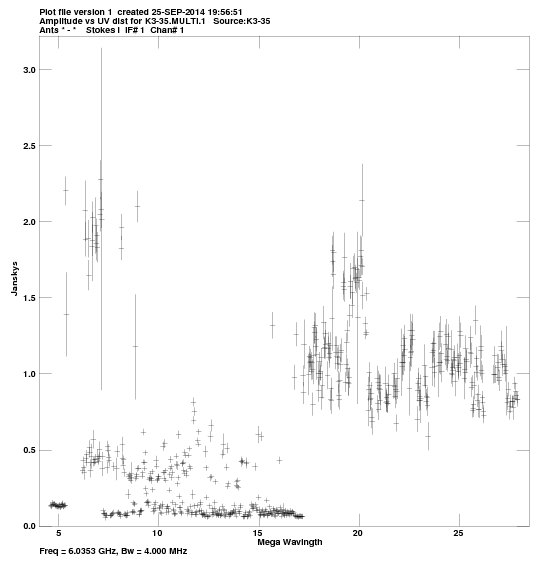
K3-35:
pdf
, or
png
.
Comments.
For each source, a plot of amp vs. |uv| distance.
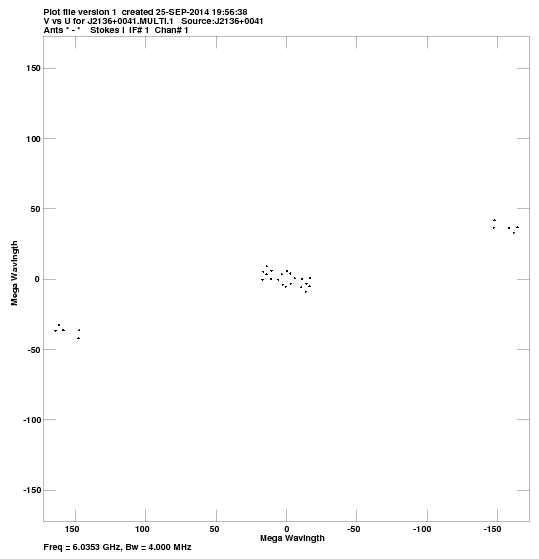
u,v coverage for:
J2136+0041:
pdf
, or
png
.
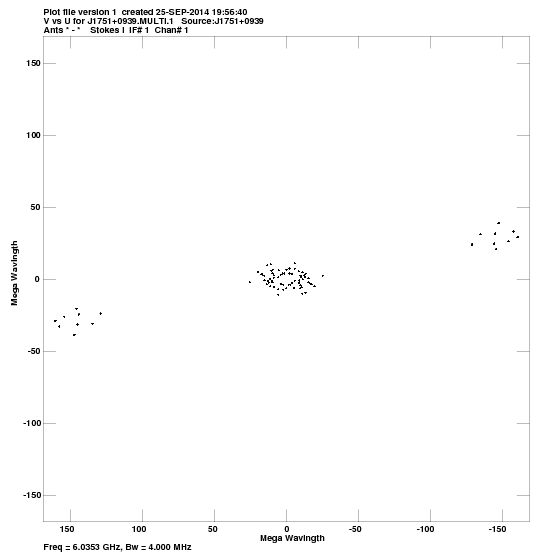
J1751+0939:
pdf
, or
png
.
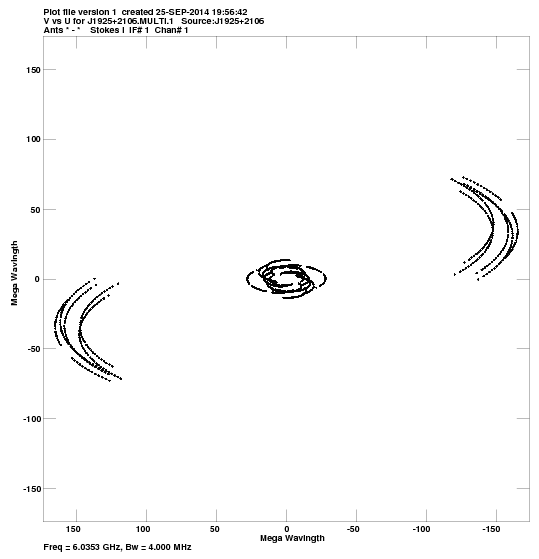
J1925+2106:
pdf
, or
png
.
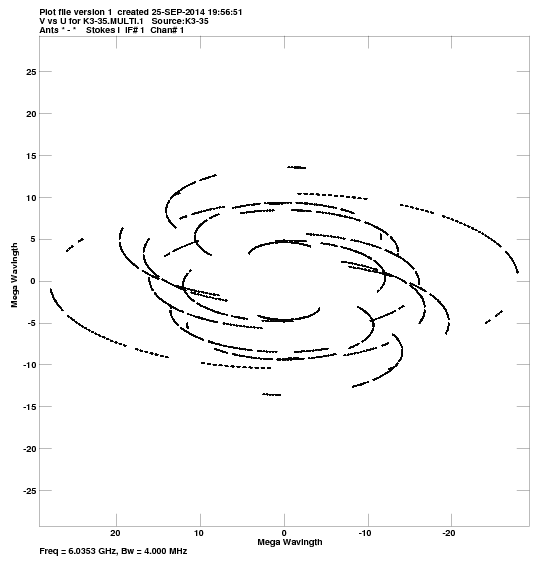
K3-35:
pdf
, or
png
.
Comments.
For each source, a plot of the u-v coverage.
Crude maps of sources:
J2136+0041:
pdf
, or
FITS
.
J1751+0939:
pdf
, or
FITS
.
J1925+2106:
pdf
, or
FITS
.
K3-35:
pdf
, or
FITS
.
Comments.
For each source, a CLEAN map resulting from the automated fringing and self-cal iterations in the pipeline script.