
EVN User Experiment Pipeline Feedback
Last updated: Mon Aug 21 11:56:51 CEST 2006
campbell@jive.nl
General Comments.
(
Brief data summary
and
scan listing
)
EM061C had 8 stations, 8 2MHz IFs, and two polarizations. The continuum pass ran with all 8 IFs, with 128 frequency points per IF/pol, and the line pass ran with just 1IF (IF3), with 1024 frequency points per IF/pol. Integration times for both were 1s. Considerably more information is included in the experiment's cover letter on the standard-plots portion of the EVN Archive. In the pipelining, only J1834-0301, J2253+1608, and J1751+0939 were fringed; G28.87+0 was phase-referenced from J1834-0301. The SOLINT was set to the representative scan length for the phase-reference source J1834-0301. This pipeline page refers to the line pass only.
The EVN reliability indicator (ERI) for this experiment was
ERI = 0.938 . ERI* = 1.000 .
The ERI was 0.938. Ef also missed ~1.5hr because of snow, which reduced ERI, but not ERI*. The missing IFs on Tr and Jb were not the IF kept for the line correlation, thus do not count against the ERI here.
Plots of the autocorrelations
Comments.
232 pages, each scan plotted separately, all stations.
plots of the uncalibrated amplitude and phase
against time
Comments.
8 pages, full-experiment for Ef-* & Tr-* baselines, no calibration applied. A 1min plot-averaging was used.
Plots of the uncalibrated amplitude and phase
against frequency channel
Comments.
331 pages, scalar averaged Ef-* & Tr-* baselines, each scan plotted separately. No calibration applied yet.
The uncalibrated amplitude and phase of the crosshand
correlations against frequency channel
(not available)
Comments.
TSYS against time
Comments.
2 pages, TY1 table, each IF/pol on a separate plot. Anomalously high readings for Ef correspond to the period it was out because of snow.
Telescope sensitivities
from the a priori TSYS and Gain
curves (the square of this number gives the antenna noise (SEFD) in Jy - the
smaller the better).
Comments.
2 pages, gain amplitude from CL2 table.
Fringe-fit phase solutions
(including Parallactic
Angle correction).
Comments.
2 pages, CL3 station phase solutions -- CL3 = CL2+SN2, thus also includes the initial amplitude/parallactic angle calibration from CL2 and the fringe solutions from SN2. When Ef is the reference station, its plot shows the effect of the parallactic angle correction.
Fringe-fit delay solutions
Comments.
2 pages, SN2 station delay solutions for the fringed sources, each IF/pol on a separate plot. When Ef is out from ~0640-0800 because of snow, there are gaps in the other stations' fringe solutions (except on the fringe-finder scan), suggesting that using Tr as an alternate reference station wasn't sufficient here. Only a few solints from Hh remain, and Jb & Tr also lose some solints
Fringe-fit rate solutions
Comments.
2 pages, SN2 station rate solutions.
Telescope bandpasses
Comments.
2 pages, bandpass table 1. Only J1719+0939 & J2253+1608 were used for bandpass calibration.
Calibrated amplitude and phase against time
(a
priori amplitude calibration and fringe-fit solutions applied).
Comments.
8 pages, full-experiment for Ef-* & Tr-* baselines, calibrated with CL3. The 1-min plot-averaging still applied.
Calibrated amplitude and phase against frequency
channel
Comments.
220 pages; Ef-* & Tr-* baselines calibrated with CL3 and BP1.
Naturally weighted dirty map (not useful for bright sources)
produced before self-cal of:
J2253+1608: pdf (not available)
, or
FITS (not available)
.
G28.87+0:
pdf
, or
FITS
.
J1751+0939: pdf (not available)
, or
FITS (not available)
.
J1834-0301: pdf (not available)
, or
FITS (not available)
.
Comments.
Natural-weighted (dirty) maps for G28.87+0.
Uniformly weighted dirty map (not useful for bright sources)
produced before self-cal of:
J2253+1608: pdf (not available)
, or
FITS (not available)
.
G28.87+0:
pdf
, or
FITS
.
J1751+0939: pdf (not available)
, or
FITS (not available)
.
J1834-0301: pdf (not available)
, or
FITS (not available)
.
Comments.
Uniform-weighted (dirty) map for G28.87+0.
Phase corrections applied to a priori calibrated and
fringe-fitted data by self-calibration.
J2253+1608
.
G28.87+0 (not available)
.
J1751+0939
.
J1834-0301
.
Comments.
Plots of post-SPLIT tables SN1 for the sources J1834-0301, J1719+0939, and J2253+1608. 2 pages per source.
Amplitude corrections applied to a priori calibrated and
fringe-fitted data by self-calibration.
J2253+1608:
pdf
, or
text file
, or
statistical summary
.
G28.87+0: pdf (not available)
, or
text file (not available)
, or
statistical summary (not available)
.
J1751+0939:
pdf
, or
text file
, or
statistical summary
.
J1834-0301:
pdf
, or
text file
, or
statistical summary
.
Comments.
As above, but for the post-SPLIT table SN2.
Telescope sensitivities
(the total AMP gain applied
during both a priori and self calibration; the square of this number gives the
antenna noise (SEFD) in Jy).
Comments.
CL4 gain-amp. Stations are fairly close to than the square-root of the SEFD listed in the EVN status table (Mc & Tr might be a little lower).
Residual closure phase (visibility closure phase with model closure phase subtracted) for:
J2253+1608
.
G28.87+0 (not available)
.
J1751+0939
.
J1834-0301
.
Comments.
Separate files per (fringed) source, showing closure phase plots for all the triangles (not just Ef-*-* or Tr-*-*). Only stokes=I shown. 7-12 pages per (fringed) source. The plot symbol seems to have become a "\" rather than a "+", but this is purely cosmetic.
Calibrated visibilities and the source model of:
J2253+1608
.
G28.87+0 (not available)
.
J1751+0939
.
J1834-0301
.
Comments.
For each (fringed) source, plots of amp/phase on Ef-* & Tr-* baselines, calibrated with (post-SPLIT) table CL3, with a model-line overplotted. 6-8 pages per source.
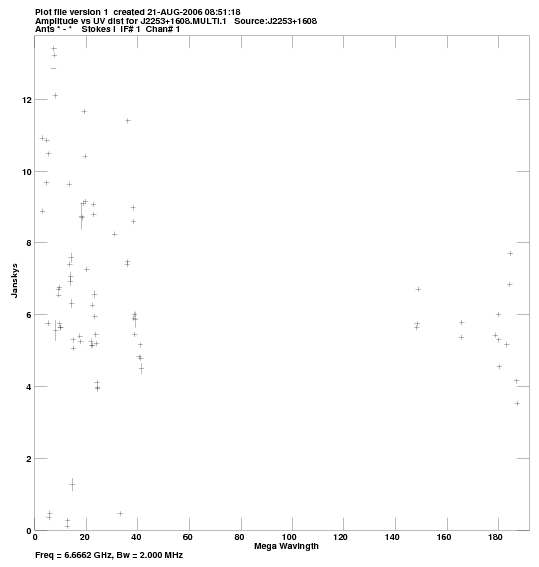
Calibrated visibilities against u,v distance for:
J2253+1608:
pdf
, or
png
.
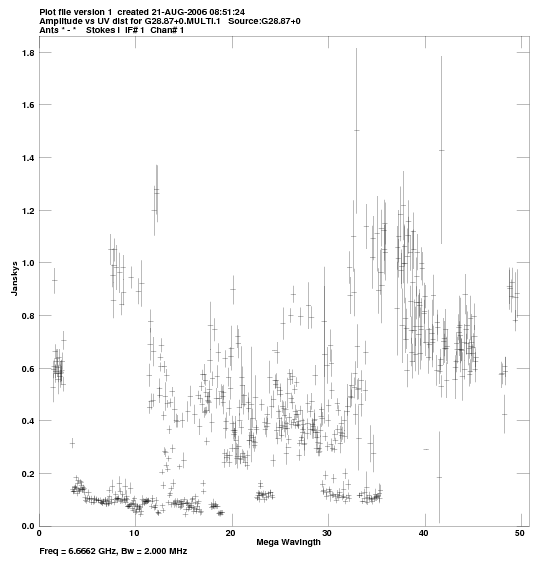
G28.87+0:
pdf
, or
png
.
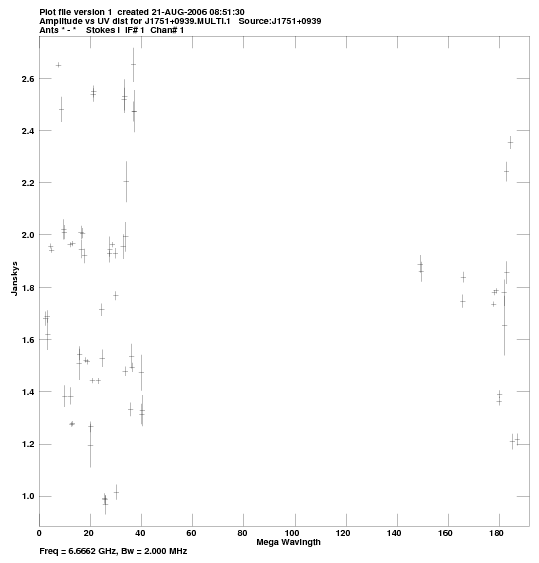
J1751+0939:
pdf
, or
png
.
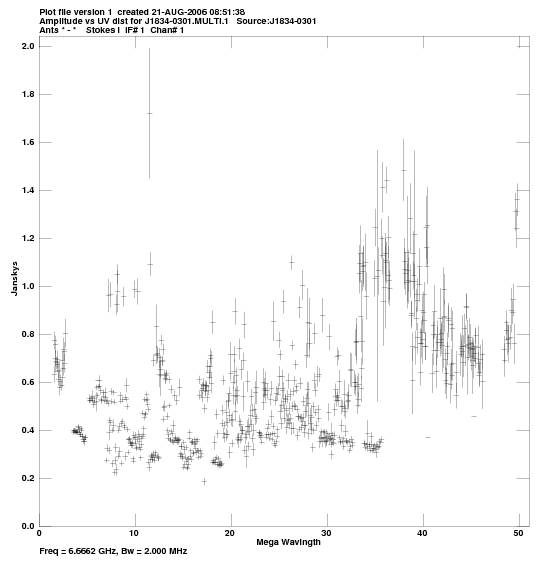
J1834-0301:
pdf
, or
png
.
Comments.
For each source, a plot of amp vs. |uv| distance.
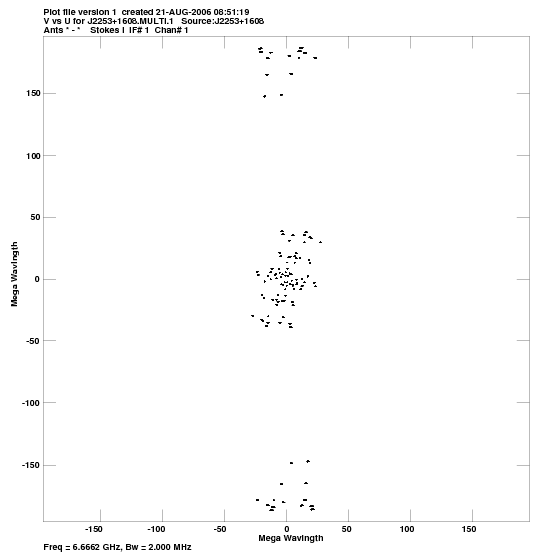
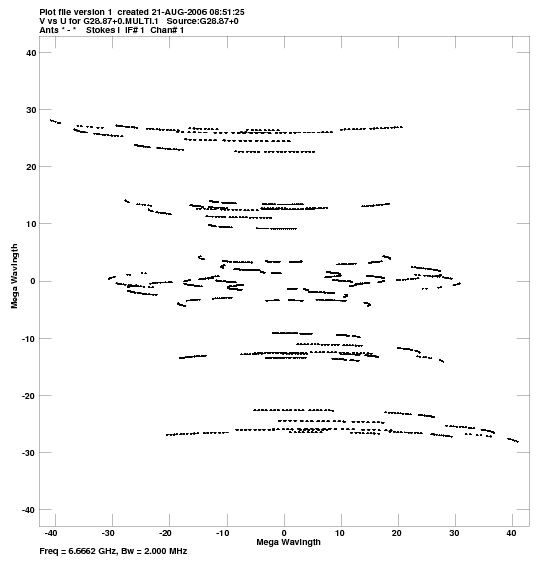
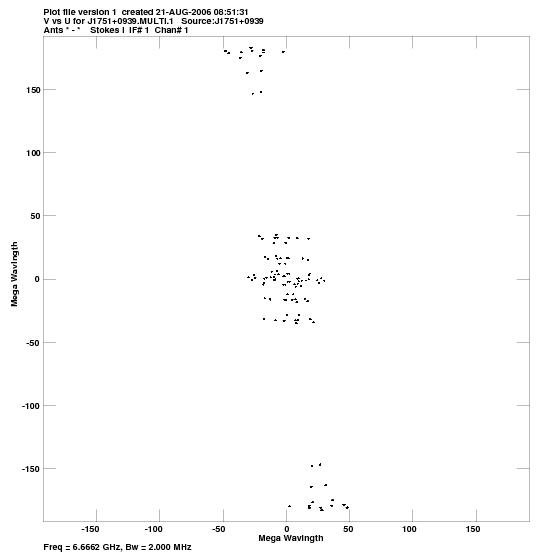
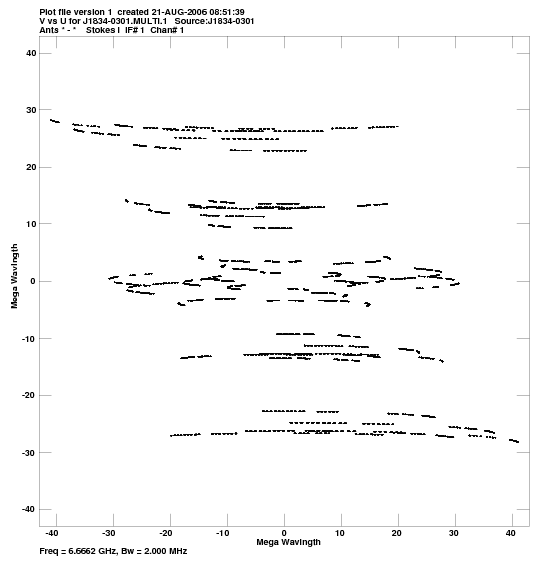
u,v coverage for:
J2253+1608:
pdf
, or
png
.
G28.87+0:
pdf
, or
png
.
J1751+0939:
pdf
, or
png
.
J1834-0301:
pdf
, or
png
.
Comments.
For each source, a plot of the u-v coverage.
Crude maps of sources:
J2253+1608:
pdf
, or
FITS
.
G28.87+0:
pdf
, or
FITS
.
J1751+0939:
pdf
, or
FITS
.
J1834-0301:
pdf
, or
FITS
.
Comments.
For each source, a CLEAN map resulting from the automated fringing/self-cal pipeline script.