
EVN User Experiment Pipeline Feedback
Last updated: Mon Jun 12 11:06:10 CEST 2006
campbell@jive.nl
General Comments.
(
Brief data summary
and
scan listing
)
EM058A had 8 stations, 2 2MHz IFs, and two polarizations. There were separate continuum (128 frequency points per IF/pol) and line (1024 frequency points over the lower IF only) passes, and integrations times were 2s. The continuum & line passes produced separate sets of FITS files. This pipelining (EM058A_1*) corresponds to the continuum pass. Considerably more information is included in the experiment's cover letter on the standard-plots portion of the EVN Archive. In the pipelining, all sources were fringed, except 05358+35, which was phase-referenced from J0530+3723. The SOLINT was 3min (scan lengths for J0530).
The EVN reliability indicator (ERI) for this experiment was
ERI = 0.723 . ERI* = 0.750 .
The ERI was 0.723. The much weaker-than-expected fringes to Jb were considered a total loss of the station. Ef missed about 1.5hr due to snow, which is also reflected in ERI, but not ERI*.
Plots of the autocorrelations
Comments.
467 pages, each scan plotted separately, all stations (~2p/scan).
plots of the uncalibrated amplitude and phase
against time
Comments.
8 pages, full-experiment for Tr-* baselines, no calibration applied. A 1.5-minute plot-averaging was used.
Plots of the uncalibrated amplitude and phase
against frequency channel
Comments.
464 pages, scalar averaged Tr-* baselines, each scan plotted separately. No calibration applied yet.
The uncalibrated amplitude and phase of the crosshand
correlations against frequency channel
(not available)
Comments.
TSYS against time
Comments.
4 pages, TY1 table, each IF/pol on a separate plot.
Telescope sensitivities
from the a priori TSYS and Gain
curves (the square of this number gives the antenna noise (SEFD) in Jy - the
smaller the better).
Comments.
4 pages, gain amplitude from CL2 table.
Fringe-fit phase solutions
(including Parallactic
Angle correction).
Comments.
4 pages, CL3 station phase solutions -- CL3 = CL2+SN2, thus also includes the initial amplitude/parallactic angle calibration from CL2 and the fringe solutions from SN2. Ef is the principal reference station; it's plot shows the effect of the parallactic angle correction.
Fringe-fit delay solutions
Comments.
4 pages, SN2 station delay solutions for the fringed sources, each IF/pol on a separate plot. Very few Jb points remain after fringing.
Fringe-fit rate solutions
Comments.
4 pages, SN2 station rate solutions.
Telescope bandpasses
Comments.
2 pages, bandpass table 1. Sources DA193 & 3C84 were used for bandpass calibration.
Calibrated amplitude and phase against time
(a
priori amplitude calibration and fringe-fit solutions applied).
Comments.
8 pages, full-experiment for Tr-* baselines, calibrated with CL3. The 1.5-min plot-averaging still applied.
Calibrated amplitude and phase against frequency
channel
Comments.
407 pages; Tr-* baselines calibrated with CL3 and BP1. The amp and phase plots sef-scale, not necessarily going down to 0 in the case of the amps.
Naturally weighted dirty map (not useful for bright sources)
produced before self-cal of:
J0530+3723: pdf (not available)
, or
FITS (not available)
.
05358+35:
pdf
, or
FITS
.
3C84: pdf (not available)
, or
FITS (not available)
.
DA193: pdf (not available)
, or
FITS (not available)
.
Comments.
Natural-weighted (dirty) map for 05358+35.
Uniformly weighted dirty map (not useful for bright sources)
produced before self-cal of:
J0530+3723: pdf (not available)
, or
FITS (not available)
.
05358+35:
pdf
, or
FITS
.
3C84: pdf (not available)
, or
FITS (not available)
.
DA193: pdf (not available)
, or
FITS (not available)
.
Comments.
Uniform-weighted (dirty) map for 05358+35.
Phase corrections applied to a priori calibrated and
fringe-fitted data by self-calibration.
J0530+3723
.
05358+35 (not available)
.
3C84
.
DA193
.
Comments.
Plots of post-SPLIT tables SN1 for the sources J0530+3723, 3C84, and DA193. 3-4 pages per source (depending on whether any Jb data gets through).
Amplitude corrections applied to a priori calibrated and
fringe-fitted data by self-calibration.
J0530+3723:
pdf
, or
text file
, or
statistical summary
.
05358+35: pdf (not available)
, or
text file (not available)
, or
statistical summary (not available)
.
3C84:
pdf
, or
text file
, or
statistical summary
.
DA193:
pdf
, or
text file
, or
statistical summary
.
Comments.
As above, but for the post-SPLIT table SN2.
Telescope sensitivities
(the total AMP gain applied
during both a priori and self calibration; the square of this number gives the
antenna noise (SEFD) in Jy).
Comments.
CL4 gain-amp.
Residual closure phase (visibility closure phase with model closure phase subtracted) for:
J0530+3723
.
05358+35 (not available)
.
3C84
.
DA193
.
Comments.
Separate files per (fringed) source, showing closure phase plots for all the triangles (not just Tr-*-*). Only stokes=I shown. 7-12 pages per source.
Calibrated visibilities and the source model of:
J0530+3723
.
05358+35 (not available)
.
3C84
.
DA193
.
Comments.
For each (fringed) source, plots of amp/phase on Tr-* baselines, calibrated with (post-SPLIT) table CL3, with a model-line overplotted.
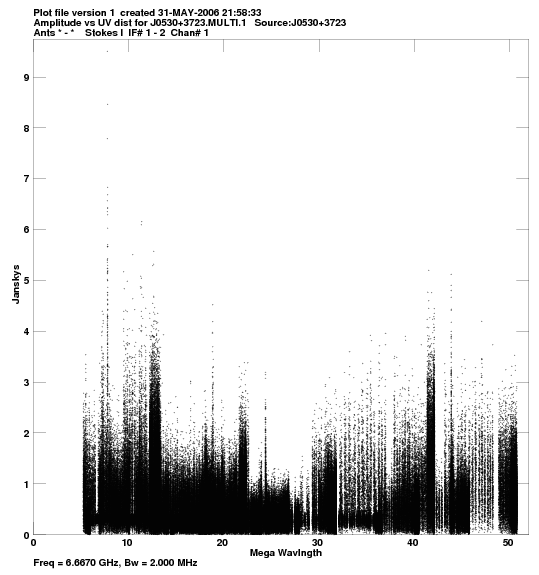
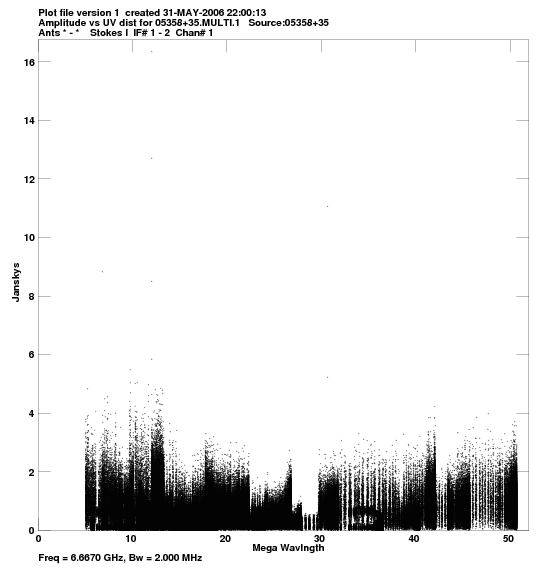
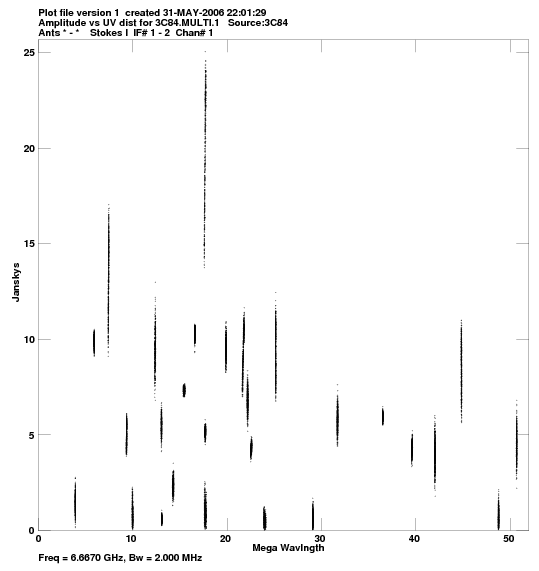
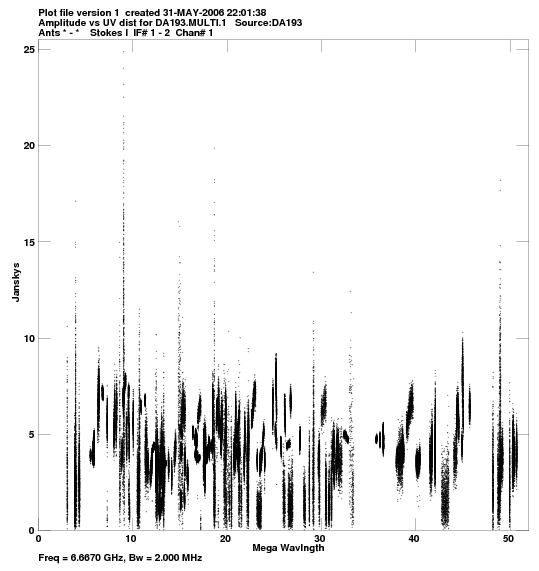
Calibrated visibilities against u,v distance for:
J0530+3723:
pdf
, or
png
.
05358+35:
pdf
, or
png
.
3C84:
pdf
, or
png
.
DA193:
pdf
, or
png
.
Comments.
For each source, a plot of amp vs. |uv| distance.
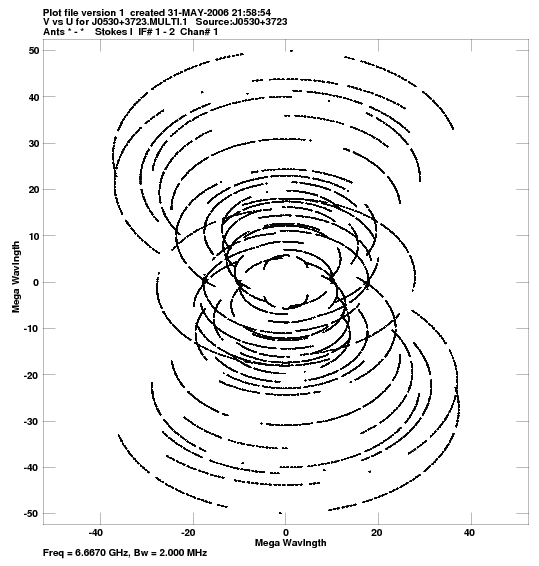
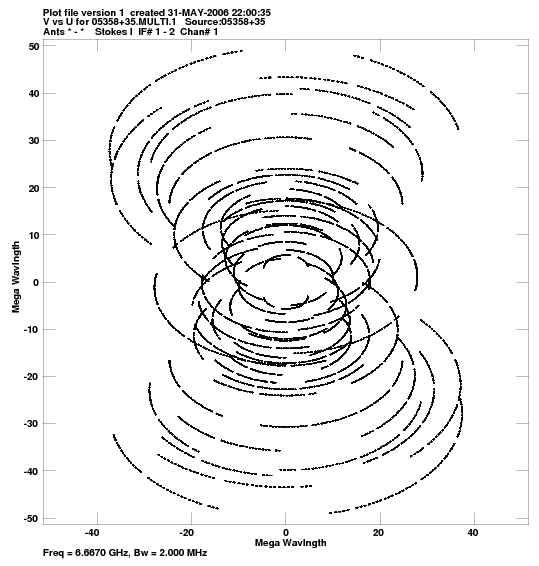
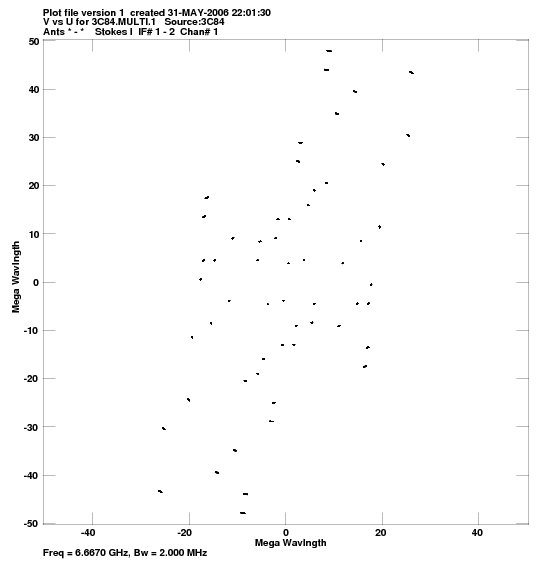
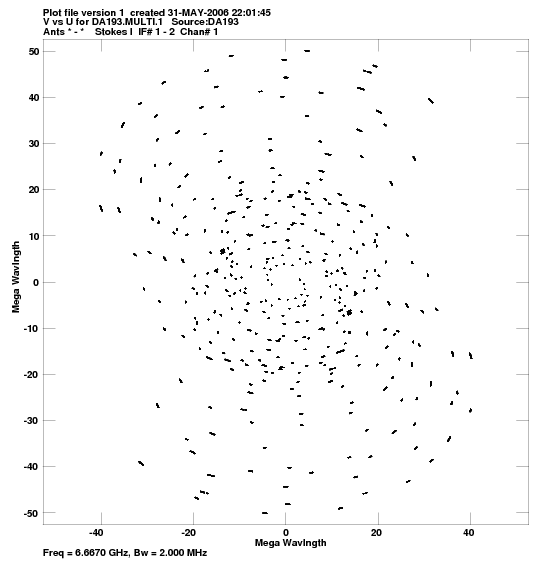
u,v coverage for:
J0530+3723:
pdf
, or
png
.
05358+35:
pdf
, or
png
.
3C84:
pdf
, or
png
.
DA193:
pdf
, or
png
.
Comments.
For each source, a plot of the u-v coverage.
Crude maps of sources:
J0530+3723:
pdf
, or
FITS
.
05358+35:
pdf
, or
FITS
.
3C84:
pdf
, or
FITS
.
DA193:
pdf
, or
FITS
.
Comments.
For each source, a CLEAN map resulting from the automated fringing and self-cal iterations in the pipeline script, or from the automated phase-referencing in the case of 05358+35.